
planet.freedesktop.org
Hi!
This month I’ve done a lot of cleanup and bugfixing in wlroots, especially in the DRM backend, the Vulkan renderer and screencopy protocol implementation. There are still a few DRM backend bugs which need to be ironed out, but we’re getting there!
Jonas Ådahl has released wayland-protocols 1.27, which features two new protocols I’ve been working on with the KDE folks. idle-notify-v1 is a standard replacement for the old KDE idle protocol we’ve been using so far. It allows clients to be notified when the user is idle for a while. This is used by swayidle to blank the screens or lock the session after a delay, for instance. Patches for wlroots, Sway and swayidle have been merged.
The other protocol is content-type-v1 and adds a way for clients to attach
a content type (such as “video” or “game”) to a surface. With this, compositors
can implement generic rules for all video players or all games. I plan to make
this available in Sway for_window rules.
Joshua Ashton has been working on improving the way a Wayland compositor will handle Xwayland surfaces. Up until now it was using a racy mechanism, and we could indeed hit the race in gamescope. We’re working on a proper solution to fix the race: xwayland-shell-v1.
To continue with the “fix old stuff which we believe was working fine but
definitely isn’t” trend, I re-implemented wl_shm in wlroots. wl_shm is the
interface used by Wayland clients to share CPU buffers (as opposed to GPU
buffers). Until now we were using the libwayland implementation but defects in
its API makes it a better way forward to just do everything ourselves.
Implementing wl_shm is fun: in particular we need to handle SIGBUS
shenanigans which the client can trigger by shrinking files mmap’ed by the
compositor. And signal handlers being what they are, this results in a lot of
complications.
In other graphics news, I’ve been doing more kernel work. I’ve tracked down
some DisplayPort Multi-Stream Transport (DP-MST) issues with Jonas and Lyude,
and sent out a fix which doesn’t break Mutter. I’ll need to send
follow-up patches to address a common issue: the docs and the code don’t match.
I’ve also sent another patch to make it less annoying to implement explicit
synchronization in Wayland compositors: a new IOCTL to
allow user-space to integrate a drm_syncobj wait with an event loop.
Together with Pekka and Sebastian, we’ve continued out work on libdisplay-info. A new website contains documentation (built via gyosu), more DisplayID bits and GTF mode generation have been merged, and Pekka is working on the high-level API.
Another unrelated small improvement worth mentioning: goguma now supports UnifiedPush! Google Play Services no longer are a required dependency to get support for push notifications.
The NPotM is go-jsonschema, a Go code generator for JSON Schema. JSON Schema can describe the structure of JSON documents, and go-jsonschema will generate matching Go structures. This is useful to avoid maintaining glue code for each and every JSON consumer. I plan to write a C code generator as well. Right now go-jsonschema can handle almost all of the drm_info schema, however many features are still missing and schemas need to be written in a specific way to make the most of go-jsonschema.
See you next time!
At Linux Plumbers Conference 2022, we held a BoF session around accelerators.
This is a summary made from memory and notes taken by John Hubbard.
We started with defining categories of accelerator devices.
1. single shot data processors, submit one off jobs to a device. (simpler image processors)
2. single-user, single task offload devices (ML training devices)
3. multi-app devices (GPU, ML/inference execution engines)
One of the main points made is that common device frameworks are normally about targeting a common userspace (e.g. mesa for GPUs). Since a common userspace doesn't exist for accelerators, this presents a problem of what sort of common things can be targetted. Discussion about tensorflow, pytorch as being the userspace, but also camera image processing and OpenCL. OpenXLA was also named as a userspace API that might be of interest to use as a target for implementations.
There was a discussion on what to call the subsystem and where to place it in the tree. It was agreed that the drivers would likely need to use DRM subsystem functionality but having things live in drivers/gpu/drm would not be great. Moving things around now for current drivers is too hard to deal with for backports etc. Adding a new directory for accel drivers would be a good plan, even if they used the drm framework. There was a lot naming discussion, I think we landed on drivers/skynet or drivers/accel (Greg and I like skynet more).
We had a discussion about RAS (Reliability, Availability, Serviceability) which is how hardware is monitored in data centers. GPU and acceleration drivers for datacentre operations define a their own RAS interfaces that get plugged into monitoring systems. This seems like an area that could be standardised across drivers. Netlink was suggested as a possible solution for this area.
Namespacing for devices was brought up. I think the advice was if you ever think you are going to namespace something in the future, you should probably consider creating a namespace for it up front, as designing one in later might prove difficult to secure properly.
We should use the drm framework with another major number to avoid some of the pain points and lifetime issues other frameworks see.
There was discussion about who could drive this forward, and Oded Gabbay from Intel's Habana Labs team was the obvious and best placed person to move it forward, Oded said he would endeavor to make it happen.
This is mostly a summary of the notes, I think we have a fair idea on a path forward we just need to start bringing the pieces together upstream now.
For those of you who weren’t present, Super Good Code took over XDC last week.
The recording of The Talk is finally sliced, diced, and tuned to perfection thanks to the work of Arkadiusz Hiler. Watch it for the first time all over again to catch all the technical details and workout tips you missed.
Additionally, the slides for the presentation are available for benchmarking.
…is something from last week even relevant today, you might be asking.
It’s a reasonable question. As everyone knows, zinkland is a place that changes so rapidly, so furiously, that memes from as recent as minutes ago are already outdated.
But in this rare case, for today only, yesterweek’s presentation is still noteworthy today: today is the day I’m merging async pipeline precompiles.
That’s right.
Drivers supporting all the required features will now be able to precompile shaders for AAA games during loading screens, which (probably) means zero stuttering during actual gameplay. The era of gaming on zink begins today.
Not all drivers support all the features out of the box. In fact, to the best of my knowledge, only the latest NVIDIA beta driver supports even the bare minimum of features, let alone the most optimal codepaths that will maximeme performance.
But have I tested it there?
I scoff at the implication.
Of course I haven’t. As we all know, zink code works without issues the instant it can be compiled, and the suggestion that any alternative outcome is possible is risible.
So don’t bother reporting bugs.
…that I misspoke in the course of my XDC presentation. I want to apologize first to the live audience, for hearing such grave information firsthand, then to my fans, for disappointing them, and lastly to the ANGLE team:
During a Q&A, I stated that ANGLE uses Vulkan secondary command buffers. This is false. ANGLE does not use secondary command buffers.
There will be no further corrections.
After 7 years in hibernation since LinuxCon Japan, I will once again be making a limited return to the conference trail next week.
To where, you ask?
XDC 2022.
Where I will be delivering a presentation that finally, at long last, unleashes the true potential of Zink as a driver.
Be there. Watch online. Tweet about it.
Big thanks to Timur for taking over merging all my misc RADV patches. I’m so far underwater I can see the bottom of the Mariana Trench, and without his help, these likely wouldn’t be landing until 2023.
It’s been a while, but today’s blog is a zink blog. What’s been happening?
Well, if you’ve been following prominent news sites, you might not think there’s too much happening on the performance front. And whew do I have news for you.
Big news.
With XDC next week, I’m throwing down the gauntlet.
Mesa 22.3 is going to be the BIG PERF RELEASE.
I said it.
Could not be more serious.
Don’t believe me? Bam, have another 20-30% performance on Turnip I “quietly” merged a month ago. And also some amount of improvement on Intel that I haven’t quantified yet. Who could’ve guessed that enabling compression on images would have benefits?
Seeing mega CPU usage? Not if I’ve got anything to say about that. Still more to come here too.
Your game/emulator randomly freezes for a few seconds on startup? I’ve heroically made the PBO download ubershaders compile without blocking. Also there’s new, optimized variants that perform even better.
What’s that? Zink is still unusable for gaming because of all the shader compilation stuttering? Blammo, your compute shaders are now precompiling in the background.
Oh, but you’re still seeing stuttering because of shader compiles? Not for long, because I’veOH SHIT KHRONOS IS HERE I’M SORRY I DIDN’T THINK IT’D BE A BIG DEAL IF I MENTIONED TH
 RB3 development board with Adreno 630 GPU
It is a major milestone for a driver that is created without any hardware documentation.
The last major roadblocks were VK_KHR_dynamic_rendering and, to a much lesser extent, VK_EXT_inline_uniform_block. Huge props to Connor Abbott for implementing them both!

VK_KHR_dynamic_rendering was an especially nasty extension to implement on tiling GPUs because dynamic rendering allows splitting a render pass between several command buffers.
For desktop GPUs there are no issues with this. They could just record and execute commands in the same order they are submitted without any additional post-processing. Desktop GPUs don’t have render passes internally, they are just a sequence of commands for them.
On the other hand, tiling GPUs have the internal concept of a render pass: they do binning of the whole render pass geometry first, load part of the framebuffer into the tile memory, execute all render pass commands, store framebuffer contents into the main memory, then repeat load_framebufer -> execute_renderpass -> store_framebuffer for all tiles. In Turnip the required glue code is created at the end of a render pass, while the whole render pass contents (when the render pass is split across several command buffers) are known only at the submit time. Therefore we have to stitch the final render pass right there.
Implementing Vulkan 1.3 was necessary to support the latest DXVK (Direct3D 9-11 translation layer). VK_KHR_dynamic_rendering itself was also necessary for the latest VKD3D (Direct3D 12 translation layer).
For now my plan is:
At LPC 2022 we had a BoF session for GPUs with two topics.
Currently most mainline distros still use the kernel console, provided by the VT subsystem. We'd like to move to CONFIG_VT=n as the console and vt subsystem have historically been a source of bugs but are also nasty places for locking etc. It also can be the cause of oops going missing when it takes out the panic path with locking bugs stopping other paths from completely processing the oops (like pstore or serial).
The session started discussing what things would like. Lennart gave a great summary of the work David did a few years ago and the train of thought involved.
Once you think through all the paths and things you want supported, you realise the best user console is going to be one that supports emojis and non-Latin scripts. This probably means you want a lightweight wayland compositor running a fullscreen VTE based terminal. Working back from the consequences of this means you probably aren't going to want this in systemd, and it should be a separate development.
The other area discussed was around the requirements for a panic/emergency kernel console, likely called drmlog, this would just be something to output to the display whenever the kernel panics or during boot before the user console is loaded.
This has been an ongoing topic, where vendors often suggest cgroup patches, and on review told they are too vendor specific and to simplify and try again, never to try again. We went over the problem space of both memory allocation accounting/enforcement and processing restrictions. We all agreed the local memory accounting was probably the easiest place to start doing something. We also agreed that accounting should be implemented and solid before we start digging into enforcement. We had a discussion about where CPU memory should be accounted, especially around integrated vs discrete graphics, since users might care about the application memory usage apart from the GPU objects usage which would be CPU on integrated and GPU on discrete. I believe a follow-up hallway discussion also covered a bunch of this with upstream cgroups maintainer.
We all know where this post is going to end up.
We’ve been there before.
We’ll be there again.
But we’re not there yet. And before we get there, I need everyone to be absolutely serious for a little while. No memes, no jokes, no puns, just straight talk from me to you.
Let’s talk about Intel.
I know what you’re thinking.
If you work for Intel, you’re thinking Oh no.
If you don’t, you’re thinking Oh no. Or possibly getting ready to post some comments about ANV not supporting features, or having bugs, or any of the common refrains that I’ve seen so often around the internet.
The fact remains, however, that ANV is the reference zink hardware driver. It has been ever since I started working on zink. The reason for this is simple: it’s what I have on the machine I develop with, and when I started working on zink, it was the driver that was furthest along.
It’s therefore no exaggeration to say that without everything ANV and the Intel Mesa team brings to the table, zink wouldn’t be nearly as far along as it is.
And neither would RADV.
For those of you unaware, at the top of many RADV code files is this comment:
 * based in part on anv driver which is:
 * Copyright © 2015 Intel Corporation
That’s right. RADV originally started out reusing a lot of code written by Intel. It’s no exaggeration to say that RADV wouldn’t be nearly as far along without Intel’s Mesa team.
Let’s go deeper though. Using LWN’s Git Data Miner (gitdm) on mesa/src/compiler (which includes GLSL, SPIR-V, and NIR), let’s see who the top contributors are to the heart of Mesa:
| Name | Commit Count | Percentage of Total | Affiliation |
|---|---|---|---|
| Jason Ekstrand | 1429 | 19.7% | Intel/Collabora |
| Timothy Arceri | 714 | 9.9% | Collabora/Valve |
| Ian Romanick | 577 | 8.0% | Intel |
| Rhys Perry | 298 | 4.1% | Valve |
| Caio Oliveira | 270 | 3.7% | Intel |
| Emma Anholt | 268 | 3.7% | |
| Marek Olšák | 260 | 3.6% | AMD |
| Kenneth Graunke | 224 | 3.1% | Intel |
| Samuel Pitoiset | 176 | 2.4% | Valve |
| Connor Abbott | 168 | 2.3% | Intel/Valve |
Again we see that Intel’s Mesa team has been hard at work over the years to enable the things that we all now take for granted.
So now you know why every time I see someone saying that ANV is bad, or Intel engineers aren’t doing everything they can, or the constant memeposting about any number of related issues, it hurts. I’ve been relying on the fruits of the Intel Mesa team’s labor for years now, and so have you.
If anything, we should be cheering them on to continue doing the great work they’ve been doing all along.
Thanks, Intel Mesa team.
I appreciate you.
And so should everyone else.
It’s time for another round of
where

is

MY SPAGHETTI?

…and meatballs, because obviously, as an American, I’m obligated to add condiments to everything. Mainly melted cheese.
In today’s edition of WIMS, I’ll be delving into the depths of Intel’s Mesa Vulkan driver to see what kinds of spaghetti they’re growing and how much of it I can eat before they catch me.
The first step, as always, is to pull out my trusty perf and…
Once again, I know what you’re thinking.

You’re thinking that I can’t just use perf and profile my way out real performance issues.
But what if I showed you this from my Intel Icelake machine:
$ ./vkoverhead -test 0 -duration 3 -output-only
44854
Does 44.8 million draws/second seem like a good number? Something reasonable for the ancestor of all Mesa Vulkan drivers? Let’s check out a flamegraph, just for the sake of this is my blog and I’m gonna do it whether you want me to or not.

And now I’m going to tell you

that I can too use perf for everything, and profiling is both a legitimate and useful way to improve any and all kinds of performance.
But looking at that graph, there’s something obvious that stands out here. Why is gfx11_emit_apply_pipe_flushes() showing up twice?

The answer may surprise you.
Let’s go back in time. I want everyone to pretend that it’s early 2021 again. Photos are still being taken in black and white by hipsters, nobody has toilet paper, and everything is generally worse. Vulkan is also worse because I haven’t shipped any of my extensions. Extensions like VK_EXT_multi_draw, which I implemented for a number of Mesa drivers. Drivers like RADV. And Lavapipe.
And ANV.
You might see where I’m going with this.
Yes, it was all the way back in June of 2021 that I implemented this extension for ANV. And at the time, everything was worse, including the world’s lack of our lord and savior, our premier optimizing tool, that project I’m going to keep plugging in my blog until the end of time, vkoverhead. Back then, the only way anyone could know how their driver performed at the CPU level was to use drawoverhead through zink.
And zink wasn’t as fast then as it is now; whoever was working on it back then was a total fucking idiot who couldn’t optimize his way out of a for loop.
So it’s not going to surprise anyone, and it’s not like anyone would even be mad if they found out that in the course of those trivial, barely even noticeable changes to the driver, I also maybe sorta kinda increased ANV’s draw command recording overhead. But it’s not like it was by any big amount or anything like that. I mean, it’s not like I was a total fucking idiot back… back then… Well, it’s not like I wouldn’t have realized it even if I did accidentally nerf the driver that I relied upon for my daily use by an amount that was in any way significant, right?
It’s not like it was a full 30% or anything like that.
I, uh… I have to go for now, but it’s not like Intel’s entire Mesa team just rolled up on my house or anything like that because taht would be kinda crazy haha okay but brb
So I’m back and I’m totally fine, don‘t ask if I need a gofundme for my medical bills or anything because there definitely aren’t any and I’m just great withp both hands still firmly attached and at least eight fingers in total between the two, which is, if you think about it, really just way more than anyone actually needs to write software.
And you know, I was totally gonna stop now with these new results
$ ./vkoverhead -test 0 -duration 3 -output-only
59973
but haha you know I’m being told that I’d better keep going or else hah so we’re just gonna uh gonna keep getting in there and seeing what we can find, if that’s all right with everyone? Yeah? Cool? Great, so, uh, yeah, let’s just check out another flamegraph real quick

And that’s looking just great. Yeah, it’s really great, isn’t it? It’s not? Okay, well, we’ve got some options. Uh, yeah, lots of options. Not like I need help figuring out what they are or anything, since this is what I’m good at. But there’s this big old gfx11_cmd_buffer_flush_state call sticking out like a sore thumb—and I’ve obviously still got two of those like everyone else—so let’s see what we can do about that.
Yup, well, it’s looking like inlining those functions is…
What?

You’re telling me I can’t just inline everything?

But it’s improving performance!
$ ./vkoverhead -test 0 -duration 3 -output-only
71192
And that’s great, isn’t it? An extra 60%+ draw throughput on ANV from a couple small patches? Yeah? Oh, okay, so we’re done? Yeah, no, that’s great, that’s really great. What a relief. I’m so glad we could come to an understanding. No, no, it was no trouble. No, I don’t think we’ll need to do this again, either. Learned a lot today. Just learning all around.
Well, we made it through that—not like there was anything special or unusual happening today, just an ordinary turn of phrase—and everything’s fine.

But what does this mean for real-world performance results, you’re asking?

I’m just micro-optimizing for the benchmarks that I write, not saying this will double your Cyberpunk 2077 FPS.
I’m not saying it.
Hi all!
This month I’ve been working on stuff I’d usually not work on willingly. And by that I mean Rust and screen tearing of course.
I’ve been randomly typing keys on my keyboard and before I knew it, a
wlroots-rs repository was created. Everybody is saying how difficult (or even
impossible) it is to write Rust bindings for wlroots so I wanted to see for
myself and give it a try. One thing is clear: these people weren’t wrong. The
first step was to wire up bindgen to automatically generate Rust declarations
from the wlroots headers, and that was easy enough. Then I needed to figure out
how to use libwayland’s intrusive linked lists (wl_list, wl_signal and
wl_listener) from Rust. I took a while to build a basic example where a
fixed wl_signal is listened to. Then it took more time to figure out a
(hacky) way to abstract that into a re-usable helper. And now I’m stuck at
trying to figure out a reasonable Rust API.
The main issue is that Rust lifetime concepts don’t map well to wlroots/Wayland.
I’ve taken some inspiration from Smithay and introduced a BackendHandler
trait which can be implemented by a compositor, and which has its methods
called when a wlroots signal is emitted. This works nicely for simple cases,
but sometimes signals are used to introduce new objects to the compositor
(e.g. wlr_backend.events.new_output). Sometimes signals reference an existing
object. If the compositor owns all wlroots objects, then wlroots can’t fire a
signal referencing these objects. Also, the compositor would like to listen to
signals on objects created by wlroots, e.g. wlr_output.events.destroy. My
next try will maybe introduce some kind of wlroots object handle (and there can
be multiple handles referencing the same wlroots object), but not sure how it’ll
turn out. If you have any good ideas, please share! My latest work is sitting
in the handler-v2 branch.
In other graphics news, I’ve been working on adding screen tearing support to the kernel and Wayland. In the past I’ve been pretty averse to screen tearing, because I personally find it very undesirable. But I’ve come to understand that it can be viewed as a user preference, and some people want to turn it on when playing a game. After seeing some people ask about it in #wayland, and seeing that Valve wants it too, I’ve decided to bite the bullet and implement the missing pieces. To be clear, tearing will be opt-in, only used when explicitly enabled by the user.
There are two missing pieces. The first one is in the kernel uAPI: user-space
has no way to perform tearing page-flips with the atomic uAPI. I’ve sent
patches to address this. The second missing piece is
in the Wayland protocol: Vulkan apps have a way to request tearing via
VK_PRESENT_MODE_IMMEDIATE_KHR, but Mesa doesn’t have a way to communicate
this preference to the Wayland compositor. Xaver Hugl has been working on a
protocol extension for this, and I’ve been working on
a Mesa implementation.
Work on libdisplay-info is continuing slowly. The EDID format is really trying very hard to be as annoying to parse as possible, but it makes for a good project to work on when I don’t want to think too much. I’ve started adding DisplayID support, which is the more modern standard for display device metadata. I’ve experimented a bit with Emscripten and wrote a web version of the tool.
As a freedesktop.org sysadmin, I’ve migrated our secondary nameservers. We were using SPI’s nameservers but these are getting decommissioned, so I’ve switched to Gandi’s. I’ve also investigated issues with our SMTP server: spammers were issuing a lot of subscription requests, so our outgoing queue was full and mail providers were starting to reject our emails. I had to ban the spammers and purge the bad emails from our queue.
I’ve made some good progress on IRC software. If you haven’t read it already,
I’ve written a blog post about ongoing work on OAuth integration with IRC.
Goguma finally gained support for the /me command and better handles sending
long messages. I’ve released a new bugfix version of soju, with various
stability improvements around stuck WHO responses and Web Push. I’ve also
fixed a bug in OFTC’s server which was causing some issues with
soju and Goguma.
That’s it for now, see you next month!
As I’ve mentioned in a couple posts, I’m somewhat of a spaghetti expert. In my opinion, the longer and more plentiful the spaghetti is, the better.
So let’s take a look at one of my favorite spaghetti recipes.
Today’s spaghetti comes from my new favorite brand of spaghetti feed, vkoverhead. It’s a simple brand, but it really gets the job done when it comes to growing great spaghetti. This particular spaghetti feed is vkoverhead -test 0, which is the most simple type. It grows the kind of spaghetti that everyone notices because it’s a staple of all graphics diets.
If I check out the state of this spaghetti feed with RADV now, I see the following:
$ ./vkoverhead -test 0 -output-only -duration 3
28345
Thus, I can see that I’m getting 28.3 million draws/second. Not too bad. Let’s check AMDPRO to get a little competition going.
$ VK_ICD_FILENAMES=/home/zmike/amd_pro.json ./vkoverhead -test 0 -output-only -duration 3
32889
what
What.
THEY DARE?
…that AMDPRO is 15% faster than RADV. Yup, it’s totally fine. No anger problems here, no sir, not with me, not even a little furious.
Cool as a cucumber.
But if—and this is obviously just a hypothetical—If I were enraged and just recovering from a lengthy tantrum after seeing these results, I’d be looking at growing some artisanal spaghetti. To do that, I’d be running perf on the vkoverhead case and then checking out a flamegraph, which might even happen to look something like this

and you know it’s weird that the graph would look like that since in a graph like that the actual emission of draw packets is only 18% of the CPU time, which means it’s just throwing away CPU cycles, and no wonder the performance is worse, and I hate Wednesdays.
But again, don’t ask if I’m okay, I’m completely fine, this isn’t bothering me.
But if—and this is obviously just another hypothetical—If I’d just come back from a counseling session that was supposed to help me cope with these inferior performance results and wasn’t feeling any better at all, then I’d definitely be craving some spaghetti. And so I’d be looking at radv_emit_all_graphics_states() and radv_upload_graphics_shader_descriptors() to see what the actual farfalle was going on with these fat pieces of stortini.
And in the first of those functions, I’d see there were all kinds of null checks and branch chain disasters that were annihilating performance, so I’d probably rip and tear those right out, and then, just while I happened to be in the area, I’d simplify some cache-killing indirect access, and, well, it’s not like I’d leave without clearing up those branches, right? Hah, of course not, though this is all just hypothetical anyway.
Stop asking. I’m fine.
If I wasn’t fine, I’d probably be running vkoverhead again at this point and seeing the following results
$ ./vkoverhead -test 0 -output-only -duration 3
36006
and then I’d be fine anyway since now RADV is up by 10%. Which is okay. It’s not bad. Nothing to brag about, you know, just being up by such a tiny little amount over the competition, but it’ll do.

Is what a responsible person would say.
But here at SGC, responsibility flies out the window when performance is involved, and I don’t have enough spaghetti yet, so buckle in because this pasta machine is just getting started.
It’s perf time again, and I’ve got another totally hypothetical flamegraph

which is less consumed by the stupidity of those fat pieces of stortini I insalted above, but I’m not in the mood for stortini at all today. They gotta go. radv_upload_graphics_shader_descriptors() I got my eye on you and your little radv_flush_constants() too. Why is radv_flush_constants() even showing up here? What’s the deal with that? There’s no constants to flush. I’m taking ‘em out.
Get the rolling pin, flatten out the dough, and what happens?
$ ./vkoverhead -test 0 -output-only -duration 3
38629

…with perf, and I’m getting out another flamegraph, and it’s better

because of course it is. That draw packet emission is getting more time, the fat stortini is slimming down, and everything is great.
But does anyone out there actually think I’m about to stop now? When I’m only up by a tenuous 36% from where I started, and my lead over AMDPRO is a barely-noticeable 17%?
Take off your jacket, because I’m turning the heat of the burners up to high.
Look at this eyesore

I’m about to end this function’s whole career. By inlining it.
$ ./vkoverhead -test 0 -output-only -duration 3
41878

When serving any sort of dish, it’s important to add a garnish. And you know what isn’t a fucking garnish?

This thing in my debugoptimized build.
So now it’s gone and what is the performance at now?
$ ./vkoverhead -test 0 -output-only -duration 3
44073

Incredible. The flavor (of winning), the atmosphere (of being a winner), the experience (of being #1), are all unparalleled.
This makes for a 55% increase in RADV’s draw throughput as well as a much more reasonable 30% lead over AMDPRO.
All from growing just the right amount of spaghetti.
In the past few days I’ve been working on better integrating IRC with OAuth 2.0. In a nutshell, my goal is to make IRC clients obtain a token by interacting with an OAuth 2.0 server, and then use that token to authenticate with the IRC server. This effort has resulted in various patches for meta.sr.ht’s OAuth 2.0 server, for the soju IRC bouncer and for the gamja & goguma IRC clients.
My motivation is to improve chat.sr.ht’s authentication. chat.sr.ht is a hosted soju IRC bouncer for SourceHut users. The soju instance delegates authentication to meta.sr.ht so that users can login with their SourceHut credentials.
The status quo is not ideal:
srht branch) with special patches to
integrate with SourceHut. It’s not the end of the world, but rebasing is
never fun and error-prone, and it would be much nicer to be able to use
vanilla soju.I’d like the solution to these problems to only use standardized APIs. That way any client or server with similar needs can implement the same standards and inter-operate with each other. For instance, one could add support for the standards in a GTK IRC client and have it work with chat.sr.ht. One could setup soju to use a GitLab instance as an OAuth server for authentication.
Before anybody complains about OAuth ruining IRC: this effort is just adding new optional things clients can add support for if they want to. I expect OAuth to be out-of-scope for many IRC clients and that’s perfectly fine. The current approach of passing a personal access token as the password will keep working.
Here is a video of the end result: user loads gamja, is asked confirmation by SourceHut, then is redirected back straight to a ready-to-use gamja. The experience on Goguma is similar.
┌────────────────┐           ┌────────────────┐           ┌────────────────┐
│                │           │                │           │                │
│   IRC client   │           │   IRC server   │           │  OAuth server  │
│                │           │                │           │                │
│ (gamja/goguma) │           │     (soju)     │           │  (meta.sr.ht)  │
│                │           │                │           │                │
└───────┬────────┘           └───────┬────────┘           └────────┬───────┘
        │                            │                             │
        │                                                          │
        │              1. Fetch OAuth server matadata              │
        ├────────────────────────────────────────────────────────► │
        │ ◄────────────────────────────────────────────────────────┤
        │                                                          │
        │                                                          │
        │              2. Redirect user to login page              │
        ├────────────────────────────────────────────────────────► │
        │ ◄────────────────────────────────────────────────────────┤
        │                     3. Get back a code                   │
        │                                                          │
        │                                                          │
        │                                                          │
        │                4. Exchange code for a token              │
        ├────────────────────────────────────────────────────────► │
        │ ◄────────────────────────────────────────────────────────┤
        │                                                          │
        │                                                          │
        │       5. Authenticate      │                             │
        │          with token        │                             │
        ├──────────────────────────► │                             │
        │                            │        6. Check token       │
        │                            ├───────────────────────────► │
        │                            │ ◄───────────────────────────┤
        │                            │      7. Get back username   │
        │                            │                             │
        │ ◄──────────────────────────┤                             │
        │                            │                             │
        │                            │                             │
Here’s a high-level overview of the interactions between the IRC client, the IRC server and the OAuth server. The IRC client and servers interact via the IRC protocol as usual, and they both interact with the OAuth server via HTTP.
Step 1 is optional: the alternative is to just hardcode all of the metadata inside the client. OAuth servers require client developers to register a client ID and client secret anyways, so it’s necessary to hardcode some metadata anyways (for now — more on that later).
All of the above uses standards described in RFCs. This means there are already OAuth servers in the wild which support everything needed!
Step 1 uses OAuth 2.0 Authorization Server Metadata (RFC 8414). An HTTP GET request returns all of the data the client needs:
> curl https://chat.sr.ht/.well-known/oauth-authorization-server
{
	"issuer": "https://meta.sr.ht",
	"authorization_endpoint": "https://meta.sr.ht/oauth2/authorize",
	"token_endpoint": "https://meta.sr.ht/oauth2/access-token",
	"response_types_supported": ["code"],
	"grant_types_supported": ["authorization_code"],
	"introspection_endpoint": "https://meta.sr.ht/oauth2/introspect",
	"introspection_endpoint_auth_methods_supported": ["none"]
}
Readers familiar with OAuth will recognize that steps 2-4 are the usual OAuth
dance defined in RFC 6749. Nothing fancy here. The client redirects the
user to https://meta.sr.ht/oauth2/authorize?client_id=XXX. The OAuth server
redirects back the user to the client with a ?code=YYY query parameter. The
client then exchanges the code for a token via an HTTP request:
> curl \
    --data-urlencode grant_type=authorization_code \
    --data-urlencode code=YYY \
    --data-urlencode client_id=XXX \
    https://chat.sr.ht/oauth2/access-token
{
	"access_token": "asdf"
}
Something worth noting is that for Goguma, the redirect URI is a bit special.
Since Goguma is a mobile app, the redirection at step 3 needs to navigate from
the user’s web browser to Goguma. Following the recommendations in RFC 8252,
Goguma leverages a private-use URI scheme: it sets the redirect URI to
fr.emersion.goguma:/oauth2 (yes, it is a valid URI!). The web browser will
open Goguma when loading that URI.
Step 5 uses the IRCv3 SASL extension in combination with the SASL OAUTHBEARER mechanism (RFC 7628). SASL PLAIN could’ve been used instead, but:
Step 6 uses OAuth 2.0 Token Introspection (RFC 7662). soju sends the token to the OAuth server, and the server replies back with some useful information:
> curl --data-urlencode token=asdf https://meta.sr.ht/oauth2/introspect
{
	"active": true,
	"username": "emersion"
}
And that’s enough for soju to associate the connection with the soju account “emersion” and send back a success response to the client!
I have patches floating around for all of the projects previously mentioned:
Once all of the above is properly plumbed, this should already be a nice step forward! But there is also room for future improvements.
My patches currently don’t handle well token expiration. Clients should at least ask the user to re-authenticate again when a token expires. It would be nice to handle the refresh token and automatically obtain a new access token (would need to add refresh token support to meta.sr.ht).
Second, it’s a bit annoying for client developers to register their app on various OAuth servers. To remove that step, clients would need to dynamically obtain a client ID and secret from the OAuth server. The OAuth 2.0 Dynamic Client Registration Protocol (RFC 7591) can be used for this purpose. I am not sure how widely that RFC is implemented though.
Last, it would be best to avoid leaving behind some unused access tokens after the user logs out. OAuth 2.0 Token Revocation (RFC 7009) could be used by clients to clear these tokens.
So here we have it, the end of my Google Summer of Code journey. A few more than a hundred days have passed, and I can already tell that the seeds have been sown for me to keep collaborating with open source software from here on out.
My project’s primary goal was to create unit tests using KUnit for the AMDGPU driver focusing on code used by GPUs from the same generation of the GPU “RX 580” (DCE 11.2). We predicted that KUnit would have some limitations in regards to testing GPU’s drivers, so we expected to see some collaboration in that sense. Finally, we knew that I would be working in parallel with people writing tests for newer generations of GPUs (DCN). I planned to keep track of my weekly progress in my blog, trying to create an introductory material that could help future newcomers.
For starters, this project was completely different from what I had in mind, given that it was far from an individual experience with the Linux Kernel community; it was actually a team effort to introduce unit testing to the AMD display driver in a way that would encourage the community to spread KUnit into other GPU drivers.
Other surprise was how the unit tests didn’t really interact with the GPU, so all our worries about needing to mock devices, and intentions of writing about it, were put aside.
In retrospect, there’s still a lot to learn about the AMD codebase and graphics stack in general, but there are also many things that I’ve learned and didn’t manage to share yet, about IGT, KUnit, and the email-patch workflow, which I’ll be writing in my personal blog in addition to the pair of posts there:
I’ve also dedicated some time reviewing the posts from my colleagues as well, like:
Our patch series is still under review:
We have refactored this series many times before sending it, worrying about how the code should be organized and how the tests should be compiled. My biggest lesson was learning to let go. Do your best to send great patches and reviews to the community, but don’t let the fear of being slightly wrong hold you back from pressing the submit button.
Done is better than perfect!
I didn’t manage to write as many tests as I planned to the DCE11.2 functions, but for what it’s worth, I’m making sure that the KUnit documentation is up to date, so that anyone can write their own tests.
| Patch | Status |
|---|---|
| drm/amd/display: Introduce KUnit tests for fixed31_32 library | Under review |
In my way to introducing unit tests to the AMD display driver I’ve managed to leave some impressions behind, writing small patches and reviewing code, listed in detail on the following sections.
Kworflow is a set of bash scripts that helped me to compile and deploy the kernel in my testing system, specially valuable to bisect code. In the beginning of my journey, shortly before the community bounding period, I sent a couple of patches to KWorkflow and reviewed a Pull Request.
| Patch | Status |
|---|---|
| #592 Add support for GPUs identified as “Display controller” in kw device | Accepted |
| #607 Enhance docs for kw-pomodoro and kw-report | Accepted |
IGT GPU Tools is a collection of tools for development and testing of the DRM drivers. One of my first tasks was to run the AMDGPU test suite using the GPU “RX580”. After checking with the community that my testing setup was correct, I reported a bug to the AMD issue tracker, with proper bisection, and followed it through the patching process:
| Patch | Status |
|---|---|
| lib/igt_kmod: fix trivial typos | Under review |
| CONTRIBUTING: Add reference for GTKDoc | Under review |
| lib/kselftests: Skip kselftest when opening kmsg fails | Under review |
| lib/igt_kmod: add igt_kselftests documentation | Under review |
KUnit is the Kernel Unit Testing Framework. It not only brings a way to facilitate writing tests to the kernel, but also running them using User Mode Linux or QEMU. For most of time in the project we were discussing how to organize tests in the AMD folders, and there were a lot of lessons from that, which I intend to share. I have a lot of documentation patches in their way, some may be worth squashing, but nonetheless, I have the intention to help making the KUnit documentation as clear as possible!
The Direct Rendering Manager (DRM) is a subsystem of the Linux kernel responsible for interfacing with GPUs. There’s still a lot to learn and contribute to this subsystem, and I hope to discuss about introducing unit tests to other folders during the Linux Plumbers Conference (more about that in a following section). I only have two patches to VKMS to show, sent shortly before the community bounding period.
| Patch | Status |
|---|---|
| drm/vkms: check plane_composer->map[0] before using it | Accepted |
| drm/vkms: return early if compose_plane fails | Discarded |
Inside the DRM subsystem resides the AMD folder, where you can find drivers for many generations of AMD GPUs. Besides our main patch series, I’ve sent some minor patches and reviewed others.
| Patch | Status |
|---|---|
| drm/amd/display: make hubp1_wait_pipe_read_start() static | Accepted |
| Update AMDGPU glossary and MAINTAINERS | Accepted |
| drm/amd/display: fix overflow on MIN_I64 definition | Accepted |
| drm/amd/display: fix minor codestyle problems | Accepted |
| drm/amd/display: remove unneeded defines from bios parser | Accepted |
First, I would like to thank the X.org Foundation for accepting my GSoC proposal, for what I’ll be eternally grateful.
Next, thanks to AMD for donating the RX580 GPU which powered my testing system, and alongside Igalia allowed my mentors to take part in the GSoC program.
Moreover I would like to thank The Linux Foundation, which will enable my trip to Dublin, to attend the Linux Plumbers Conference.
There were plenty of great interactions with the DRM community, AMD, and KUnit engineers, for which I’m very thankful, specially David Gow which promptly reviewed most of my team’s patches.
And finally, thanks for my mentors and the other mentees with whom I’ve worked closely this summer, any of this would be possible without their support.
Mentors:
Mentees:
Of course this is not farewell! It’s more like reaching the end of a game’s tutorial.
My first step, thanks to The Linux Foundation and my mentors, will be attending in-person the Kernel Testing & Dependability Micro Conference at the Linux Plumber Conference, where I hope to show what we’ve achieved and to discuss about the best way to organize the tests, which is what I’ve invested most of my time, so please keep an eye out for my report about it in my personal blog in the following weeks.
In regards to coding, beyond following through with my patches under review, I intend to write the tests for the DCE functions I proposed initially and maybe extend to other generations, now that we realized that the physical device is not needed in order to write unit tests. I might even look for other modules which would benefit from unit tests, like VKMS.
Finally, I’ll also try to get involved with the KernelCI project, where I could even employ my web development experience. In order to do that I’ll be attending virtually the monthly Automated Testing Call.
Thanks for reading.
Like all things, Google Summer of Code, too, comes to an end.
Now let’s go over what had to be done, what is done, and what’s left.
Well, this is rather easy for me to talk about, I’ll be on X.org’s Developers Conference soon, and full of motivations behind the work I’ve done.
Not just me, though! Me, Maíra and Magali (who might be familiar names to you already) will be there as well, and unfortunately Tales didn’t manage to get a visa due to bureaucracy layers no one dares to understand.
Looking retrospectively, the project’s motivation boils down to Siqueira wanting to resolve an internal tension between AMD engineers and the weird code they have to manage, unit tests being like a safety valve. As I’ve talked about previously, GPU code can be quite intense, the DML module being a particularly fun example.
No tests, just procedurally generated stuff, and there is so much to be done,
really. Initially we proposed lots of tests, some docs, some refactoring, in my
case specifically I wanted to make the
drivers/gpu/drm/amd/display/dc/dml/dcn20/display_rq_dlg_calc_20.c
(breathes heavily) look pretty.
So…
Though we all had AMD code enhancement as a primary motivator, I actually did some unit tests, and at the end I was caught up in trying to understand what we were testing.
Wasn’t my smartest move (what external contributor actually knows what an RQ DLG is? Difficult answers to find, really) but I learnt so much, apart from the fact it was really satisfying to document something so convoluted and full of internal “slang” (I mean product (code)names or acronyms). But I soon found out I’d be a terrible detective, as most of the things we had to test were simply unattainable for someone who didn’t have internal docs or lots of experience with real GPUs: most things in the DML submodule refer back to themselves, to GPU internals, or even to AMD “internals”.
In the end there were some interesting results from the tests I was actually able to conclude, as follows:
drm/amd/display: Introduce Kunit tests to display_rq_dlg_calc_20
This was a single patch I’ve done on the unit tests. Of course there are lots more functions to be tested, but that comes in the next section :)
We collectively discussed some alternatives to deal with the fact the functions being tested were all static, as will be discussed by Tales in his presentation at the Linux Plumbers Conference.
LPC: How to introduce KUnit to physical device drivers?
There was also some documentation produced regarding the functions and structs involved in these tests, but they were not sent yet as they’re smaller changes and could be grouped in a patchset addressing this specifically.
KW (for the intimate) is a much needed and very interesting project, whom I tried my best to contribute to: I spent about a month and a half at the beginning of GSoC pushing it, to the point where I simply had no will to make my commit messages pretty or to respond maintainers.
Lucky me the owner of the project is also my GSoC mentor, and he completely understood where I was at and that I’d not be able to accomplish the (optional) goals I had set for KW in my proposal.
I really think this situation helped me understand better what is it that we’re doing when we contribute to free software, and that was the lesson I took.
Anyhow, there were many contributions during this period, even though I didn’t finish many of them:
Some things took a lot of our attention apart from the basic motivations of the project. As I was previously already working on IGT GPU Tools, I figured it’d be interesting to finish related work in that project. What good is making tests people aren’t going to use (or maintain?).
IGT is widely used by the kernel graphics people. It mainly tests GPU stuff using userspace APIs, but also does some other interesting things, and we figured it’d be very cool to be able to run unit tests there: easy to integrate with the pre-existing CI, not too much headache to maintain as the KTAP specs get more stable, as well as not requiring so much effort from engineers that are already so used to it.
patchset: Add support for KUnit tests
Whilst it was not so difficult from the purely technical point of view, this might be what helped me the most towards acquiring some intimacy with the C language. I felt it deep when I came back to the same code after a month or two and saw so much to improve on it, then stepped out again as I waited for v1 to be reviewed (which didn’t happen) and came back a while ago to write the v2 linked above.
There were several challenges involved, specially for me: I started coding C because of the kernel, all I knew were C-like languages, and they were all masking some deep truth about computers to me: pretty error handling, easy to use strings, etc.
I admit I wasn’t as ready for C as I thought, now that I understand it better, I can see that clearly. In the end this “quasi-traumatic” experience (and I mean the IGT patchset specifically) taught me a lot, and I’m very thankful for that opportunity (thanks, André!).
Apart from the language itself, we also had to decide what would be supported in a KTAP parser, and that wasn’t easy.
Well, for me personally this was the best part of this project, I really enjoy writing these things, I also enjoy receiving feedback – specially if it’s unasked :).
If you know my blog you know I like to go the difficult route: to talk about the objective engineering experience might teach you a lot, but where’s the fun in that? Even now I’m trying to bring some subjective matters to this.
Anyhow, I published two blog posts which you can check out here:
And I actually made lots of contributions to the Flusp site as well, whose repository was used to review these posts, which I hope will be hosted there as long as they’re hosted on my own website.
As I pointed out previously, GPU code can be very interesting! So much so, that I purposefully didn’t attempt to rush what was left of my proposal at the end of GSoC. It might have been really satisfactory to end GSoC with everything accomplished, but if I learnt anything from undergrad it is that you should NOT rush what’s important to you.
From what I’ve talked with my peers, there are two ways of seeing this project:
GSoC is like a deal I made with Google and X.org to accomplish something until a due date and get money for it.
This PoV is okay, but does it teach you anything new? I might as well have done some freelancing in that time period, would have got the money, and then I’d be very comfortable.
But I believe there’s so much more to this experience, and that’s something Siqueira told us time and again, which brings me to a second, more wholesome way of seeing things:
GSoC is a sort of first commitment to a community.
I know this doesn’t sound so clear as the first way of looking at things, but follow me on this:
For the community, timing might be important, but it’s definitely not as important as doing solid, good work, and keep pushing it even if it’s not as quickly as you’d like.
I got really burnt out from the first two years at Uni, started working, went to live by myself, all that young adult jazz. Trying to always keep up with everything was a real challenge, and though I didn’t always give my best, well I really tried.
At first, I was really sad, almost spiraling out of everything software-related, but now I see things more clearly, and I’m trying to find a rhythm that I can work with, in which I can deliver what I want, and, most importantly, what I committed to.
Going back to Siqueira, what he told us is that (translating loosely):
You got to make a dent in the community so that someone notices you.
And now I see it more clearly.
I’ve heard so many stories of people who engage on things like GSoC or Outreachy just to put it on their CV, then quit, but this is so much more important to me.
I’ve already started making a career in free software, but the project I work on at the moment doesn’t allow me to interact so directly with some upstream or a community. I definitely want to improve in doing I enjoy and believe in, and if it takes some learning that’s only part of the journey to becoming a reliable member of some free software community.
So, in concrete terms, what is there to finish?
First and foremost, the ongoing patchset for IGT needs lots of attention, as pointed by Michał Winiarski in this thread for example:
Kernel lore archives: [PATCH v5 9/9] drm: selftest: convert drm_mm selftest to KUnit
Secondly, of course, finish the original proposal of testing the
dcn20/display_rq_dlg_calc_20.c file.
Might not sound like a lot, but those are really important things, and I’m sure they’ll keep me busy for some time.
I was also pinged by some people to review their patches, and I want to get back to them soon.
I’ve really been thinking a lot about giving back to the people that helped me get here, they were all awesome and I hope I can sow these same seeds and help fellow students become contributors as well. Just last week me and Maíra decided to try to get some people for a project on (fixing) coverage reports for the tests we wrote, but I might as well find another project for myself – probably related to XR, if you’re wondering, but I should write about that in the future :)
That’s it, dear reader, thank you a lot for reading this through, see you on the next one!
Ever stop in the middle of writing some code when it hits you? That nagging feeling. It’s in the back of your mind, relentlessly gnawing away. Making you question your decisions. Making you wonder what you’re doing with your life. You’re plugging away happily, when suddenly you remember I haven’t optimized any code in hours.
It’s no way to work.
It’s no way to live.
Let’s get back to our roots, blog.
For this edition of the blog, we’re hopping off the usual tracks and onto a different set entirely: Vulkan driver optimization. I can already hear what you’re thinking.
Vulkan drivers are already fast. Go back to doing something useful, like making GL work.
First: no they’re not.
Second: I’m doing the opposite of that.
Third: shut up, it’s my blog.
How does one optimize Vulkan drivers? As we all know, any great optimization needs a test case. In the case of Vulkan, everyone who’s anyone (me) uses Zink as their test case. The reasons for this are many and varied because I say they are, but the important one to keep in mind is, as always, drawoverhead.
For those who can’t remember the times I have previously blogged about the world’s premiere benchmarking tool, don’t worry. As with any great form of entertainment, I’ve prepared a recap.
Suppose you are a large gaming-oriented company that sells hardware. Your hardware runs on a battery. The battery has a finite charge. Every bit of power drained from the battery powers the device so that users can play games.
Wouldn’t it be great if that battery lasted longer?
There are a number of ways to achieve this goal. Because this is my blog, I’m going to talk about the one that doesn’t involve underclocking or reducing graphical settings.
Obviously I’m talking about optimization, the process by which a smart and talented reader of StackOverflow copies and pastes code in exactly the right sequence such that, upon resolving all compilation errors, execution of a program utilizes fewer resources.
Now because everyone reading this is a GPU driver developer, we all know that optimization comes in two forms, optimizing for CPU and optimizing for GPU. But GPU optimization is easy. Anyone can do that. You just strap on your RadeonGPUProfiler or Nsight or , glance at the output, mumble mumble mumble, and blammo, your GPU is running like a clock. A really fast one though. With like a trillion hands all spinning at once.
So we’re done with GPU optimization, but we’re not optimized enough yet. The battery still doesn’t last forever, and the users are still complaining on Reddit that they can’t even finish a casual playthrough of Elden Ring or a boss fight in Monster Hunter: Rise without needing to plug in.
This brings us to “CPU optimization”, the process by which we use more esoteric tools like perf or dtrace or custom instrumentation to generate possibly-useful traces of where the CPU may or may not be executing optimally because it’s a filthy liar that doesn’t even know what line of code it’s executing half the time. But still, we need test cases, and unlike GPU profiling, CPU profiling typically isn’t useful with only a single frame’s worth of sample data.
Thus, drawoverhead, which provides a view of how various GL operations impact CPU utilization by executing millions of draw calls per second to provide copious samples for profiling.
This is where the blog is going to take a turn for the bizarre. Some people, it seems, don’t want to use Zink for benchmarking and profiling.
I know.
I’m shocked, hurt, appalled, and also it’s me who doesn’t want to use Zink for benchmarking and profiling so it’s a very confusing time.
The problem with using Zink for optimizing CPU usage is that Zink keeps getting in the way. I want to profile only the Vulkan driver, but instead I’ve got all this Mesa oozing and spurting onto my CPU samples. It’s gross, it’s an untenable situation, and I’ve already taken steps to resolve it.
Behold the future: vkoverhead.
With one simple clone, build, and execute, it’s now possible to see how much the Vulkan driver you’re using sucks at any given task.
Want to see how costly it is to bind a different pipeline? Got it covered.
Changing vertex buffers? Blam, your performance is garbage.
Starting and stopping renderpasses? Take your entire computer and throw it in the dumpster because that’s where your performance just went.
The obvious problem with this is that somebody has to actually dig into the vkoverhead results for each driver and figure out what can be made better. I’ll write another post about this since it’s a separate topic.
Instead, what I want to do today is use vkoverhead to delve into one of the latest and greatest myths of modern Vulkan:
Is the use of fast-linked Graphics Pipeline Libraries worse than, equivalent to, or better than VK_EXT_vertex_input_dynamic_state?
I say this is one of the great myths because, having spoken to Very Knowledgeable Khronos Insiders as well as Experienced Application Developers, I’ve been told repeatedly that VK_EXT_vertex_input_dynamic_state is just a convenience feature that should not be used or relied upon, and proper use of GPL with fast-linking provides the same functionality and performance with broader adoption. But is this really true?
Well, now that the tools exist, it’s possible to say definitively that this sort of wishful thinking does not reflect reality. Let’s check out the numbers. As of the latest 1.1 vkoverhead release, the following cases are available:
$ ./vkoverhead -list
   0, draw
   1, draw_multi
   2, draw_vertex
   3, draw_multi_vertex
   4, draw_index_change
   5, draw_index_offset_change
   6, draw_rp_begin_end
   7, draw_rp_begin_end_dynrender
   8, draw_rp_begin_end_dontcare
   9, draw_rp_begin_end_dontcare_dynrender
  10, draw_multirt
  11, draw_multirt_dynrender
  12, draw_multirt_begin_end
  13, draw_multirt_begin_end_dynrender
  14, draw_multirt_begin_end_dontcare
  15, draw_multirt_begin_end_dontcare_dynrender
  16, draw_vbo_change
  17, draw_1vattrib_change
  18, draw_16vattrib
  19, draw_16vattrib_16vbo_change
  20, draw_16vattrib_change
  21, draw_16vattrib_change_dynamic
  22, draw_16vattrib_change_gpl
  23, draw_16vattrib_change_gpl_hashncache
  24, draw_1ubo_change
  25, draw_12ubo_change
  26, draw_1sampler_change
  27, draw_16sampler_change
  28, draw_1texelbuffer_change
  29, draw_16texelbuffer_change
  30, draw_1ssbo_change
  31, draw_8ssbo_change
  32, draw_1image_change
  33, draw_16image_change
  34, draw_1imagebuffer_change
  35, draw_16imagebuffer_change
  36, submit_noop
  37, submit_50noop
  38, submit_1cmdbuf
  39, submit_50cmdbuf
  40, submit_50cmdbuf_50submit
  41, descriptor_noop
  42, descriptor_1ubo
  43, descriptor_template_1ubo
  44, descriptor_12ubo
  45, descriptor_template_12ubo
  46, descriptor_1sampler
  47, descriptor_template_1sampler
  48, descriptor_16sampler
  49, descriptor_template_16sampler
  50, descriptor_1texelbuffer
  51, descriptor_template_1texelbuffer
  52, descriptor_16texelbuffer
  53, descriptor_template_16texelbuffer
  54, descriptor_1ssbo
  55, descriptor_template_1ssbo
  56, descriptor_8ssbo
  57, descriptor_template_8ssbo
  58, descriptor_1image
  59, descriptor_template_1image
  60, descriptor_16image
  61, descriptor_template_16image
  62, descriptor_1imagebuffer
  63, descriptor_template_1imagebuffer
  64, descriptor_16imagebuffer
  65, descriptor_template_16imagebuffer
  66, misc_resolve
  67, misc_resolve_mutable
The interesting cases for this scenario are:
  21, draw_16vattrib_change_dynamic
  22, draw_16vattrib_change_gpl
  23, draw_16vattrib_change_gpl_hashncache
VK_EXT_vertex_input_dynamic_stateRunning all of these tests on NVIDIA’s driver (the only hardware driver to fully support both extensions) on a AMD Ryzen 9 5900X with a 3060TI yields the following:
| Case | Draws per second |
|---|---|
| 21 draw_16vattrib_change_dynamic | 7,965,000 |
| 22 draw_16vattrib_change_gpl | 315,000 |
| 23 draw_16vattrib_change_gpl_hashncache | 4,020,000 |
Staggeringly, it turns out that GPL is worse in every scenario. Even the speed of the typical Vulkan hash-n-cache usage can’t make up for the fact that VK_EXT_vertex_input_dynamic_state genuinely is that much faster. And assuming the driver isn’t doing low-GPU-performance heroics, that means everyone drinking the koolaid about not using or not implementing VK_EXT_vertex_input_dynamic_state should be reconsidering their beverage of choice.
This isn’t to say Graphics Pipeline Library is bad or should not be used.
GPL is one of the best extensions Vulkan has to offer, and it definitely provides a huge number of features that every application developer should be examining to see how they might improve performance.
But it’s not better than VK_EXT_vertex_input_dynamic_state.
The project is already in a state where at least one major GPU vendor is utilizing it to drive down CPU usage. If you’re a GPU driver engineer, or perhaps if you’re someone who does benchmarking for a popular tech news site, you should check out vkoverhead too.
Some key takeaways:
Stay tuned for an upcoming post where I teach a course in making your own spaghetti. Also some other things that give zink a 25%+ performance boost.
My journey on the Google Summer of Code project passed by so fast… This is my last week on the GSoC and those 14 weeks flew by! A lot of stuff happened during those three months, and as I’m writing this blog post, I feel quite nostalgic about this three months.
Before I started GSoC, I never thought I would send so many patches to the mailing list, have an abstract approved on XDC 2022, or have commit rights on drm-misc.
GSoC was indeed a fantastic experience. It gave me the opportunity to grow as a developer in an open source community and I believe that I ended up GSoC with a better understanding of what open source is. I learned more about the community, how to communicate with them, and who are the actors in this workflow.
So, this is a summary report of all my journey at GSoC 2022.
First I will kick off with my non-related contributions. I mean, they are somehow related to my project, but they are not exactly unit tests for AMDGPU.
kworkflow is a tool for reducing the environment and setup overhead of developing for Linux, which is maintained by my mentor Rodrigo Siqueira. I use it to manage my config files, deploy to my testing machine, check code style, and more. Initially, kw didn’t have support to deploy for Fedora-based machines.
During the Community Bonding Period, I added support to deploy Fedora-based machines and I wrote a bit about this story in this blog post. Moreover, I fixed a couple of bugs that I spotted while using it.
| Patch | Status |
|---|---|
| docs: dependencies: Add pv to Fedora dependencies | Accepted |
| src: kwlib: check if the context is inside a git worktree | Accepted |
| Add deploy support to Fedora-based systems | Accepted |
| src: help: Fix renaming of configm to kernel-config-manager | Accepted |
IGT GPU Tools is a collection of tools for the development and testing of DRM drivers. During GSoC, I ran the AMDGPU suite a couple of times on my testing machine with a single display connected through HDMI. With this setup, I was able to detect a couple of failures on the IGT tests and I reported some of those issues on the AMD bug tracker, but also I sent two patches fixing a couple of failures on the test.
| Patch | Status |
|---|---|
| [i-g-t,v2] tests/amdgpu: Skip multihead MPO tests on single display | Accepted |
| [i-g-t,v2] tests/amdgpu/amd_bypass: skip if connector is not DisplayPort | On Review |
KUnit is the Kernel Unit Testing Framework. It is the framework we used for creating unit tests for the AMDGPU drivers. My patches to KUnit are based on problems that I noticed I could improve while I was writing unit tests for VBA. First, I fixed a simple documentation error I spotted when I consulted the docs. The other patches are a bit more interesting.
While I was writing some tests, I realize I was using a lot of expectations such as:
KUNIT_EXPECT_EQ(test, memcmp(buffer1, buffer2, size), 0);
And I also realize that the output of this expectation can be quite non-helpful,
as it only gives the output of the memcmp function. So, I created an
expectation macro for analyzing blocks of memory and outputs the hexdump of the
memory.
It was a great community experience to interact with the KUnit developers and work on their feedback.
In the DRM subsystem, I contributed to the DRM unit tests, which used to be selftests and I converted them to KUnit during an LKCamp hackathon with other students. I explained more about those tests in this blog post. After those patches were merged, I dedicated myself to some janitorial duties on the tests folders: fixing stack warnings, refactoring some tests, and making the naming more consistent.
Also, this summer, I applied for commit rights on the drm-misc repository and it was approved. I got pretty glad to have commit rights, although I believe it is such a huge responsibility and I plan to use this right very carefully. I must thank my mentor Melissa Wen for encouraging me to ask for commit rights and for sharing her knowledge about the community and maintainership models (and also for answering a thousand questions I had about dim).
Most of my patches to the AMDGPU branch were ideas that I had while writing the
unit tests on VBA. The display_mode_vba files were automatically generated,
which means that the code might not be the most readable one. During the summer,
I had a couple of ideas for cleaning up a bit of the VBA files and some of those
ideas are documented in this blog
post.
And most of my patches are related to this matter.
But, most of the patches I sent related to the VBA files weren’t merged and there was also no feedback on the patches. Some were sent multiple times, but I didn’t get an answer. The DML is a very sensitive part of the AMDGPU driver, so big changes might not be suitable for them.
Moreover, there are a couple of fixes. My favorite one is the drm/amdgpu: Fix
use-after-free on amdgpu_bo_list mutex, which was a fix to a use-after-free
problem that appeared in the mailing
list.
It was fun to read the output provided in the mailing-list and then track the
bug based on the trace. Also, it was a really nice interaction with other
developers on the mailing list.
After this huge tangent, let’s jump into the real milestones of the GSoC project. Making a small recapitulation of the idea of my project:
The Display Mode Library (DML) is a fundamental part of the AMDGPU driver. It involves lots of complex calculations and a large number of parameters. That said, it points to itself as a great candidate for the implementation of unit tests. Unit tests will help graphic developers recognize bugs before they are merged into the mainline and make it possible for a future code refactor. This project intends to implement unit testing in the Display Mode VBA libraries, especially the Display Mode VBA public API and the DCN20’s Display Mode VBA functions.
In my project, the deliverables were:
display_mode_vba and display_mode_vba20.So, let’s discuss point by point the milestones of this summer.
First, I had the intention to write unit tests for all the public functions on
display_mode_vba and display_mode_vba20, which are eleven functions in
total. Initially, it seems like a good idea to test only the public functions,
which is usually recommended by Software Engineering authors.
I started following this plan, but as I was learning more about unit testing, I started questioning the feasibility of tests for some functions. I mean, a couple of functions had more than 45 input parameters and more than a thousand lines. Checking all the possible code branches of those tests seemed to me unfeasible because there were a lot of variables to be considered.
As the function size and the number of parameters grow, the complexity of the tests grows exponentially.
So, I ended up writing tests for some static VBA functions. In the end, I wrote more than eleven unit tests but the functions for which they were written are not the same as planned initially.
The functions were chosen by two means. First, I was trying to identify
functions with a more suitable behavior for unit tests. Basically, functions
with no more than 10 parameters and 100 lines. Also, I was looking for functions
that were used a lot in the code, in order to increase the coverage and the
relevance of the tests. But also, sometimes, Siqueira would suggest some
functions outside of VBA, such as the dc_dmub_srv case, which was inspired on
a regression.
Moreover, I also wrote documentation for the tests, giving instructions on how to run the tests and how to add more tests to the AMDGPU driver.
The patches with the test suites and documentation are listed here:
The tests are not merged yet and are currently on the second version, but there are some good changes that the tests will be merged soon to the mainline.
Moreover, I was able to run all the unit tests developed on the AMDGPU Radeon RX 5700 XT, and also with the kunit-tool.
During the summer, I wrote five blog posts about challenges that I found interesting in my journey. All blog posts are listed here:
| Date | Post |
|---|---|
| May 26, 2022 | I’m in GSoC ‘22 |
| Jun 11, 2022 | Linux Kernel Developing with Fedora |
| Jul 11, 2022 | About Kernel Symbol Table, Compilation, and more |
| Jul 19, 2022 | From Selftests to KUnit |
| Aug 10, 2022 | Does the Linux Kernel need software engineering? |
During this summer, I was able to evolve my community skills also. Before I joined GSoC, I didn’t though I had enough knowledge to review code from others or even read the mailing list. Now, I have more confidence to review and test some patches (and even commit a patch).
During GSoC, I developed the habit to read the mailing list daily. Although I don’t really get everything that is going on there, I read a couple of threads and try to understand what is being discussed. And it became a fun part of my day to open Thunderbird and read the mailing lists from AMDGPU, DRM, KUnit, and Fedora Devel.
Moreover, during my mailing list readings, I was able to find some discussions that I could contribute to and even review patches. Initially, I didn’t have confidence enough to send a Reviewed-by, so I used to send just a Tested-by. But, now I feel more courage to send a Reviewed-by and make an argument for my points on the mailing lists.
I made more than a dozen interactions on the mailing list, so I will just list the more relevant ones:
Moreover, I also
committed
two patches on drm-misc-next. I reviewed to patches for improving the DRM
KUnit tests and by the end of the review, I usually wait for someone to push the
patches into drm-misc-next, but as those patches were on the list for a while,
I decided to push it myself. I was pretty afraid of doing something wrong, but
all went fine with a bit of help from Melissa.
Well, I’m pretty excited about the next couple of months for many reasons. First, I, Magali Lemes, and Isabella Basso will be attending XDC 2022. It is going to be very exciting to participate in an in-place conference and also to make a presentation on the main track.
We are going to talk about the “KUnit sorcery and the uncanny nature of FPU in the DRM” on October 4th, presenting a bit of our GSoC project. So, currently, I’m training a lot to make a good presentation in October.
Moreover, I intend to keep contributing to the DRM subsystem, and currently, I have some ideas for some code refactors of the DRM KUnit tests. Also, I would like to expand my contributions on the DRM to not only test-related. Although I do like to write unit tests, I want to learn more about planes, CRTC, color management, memory management, and more. Currently, most of my contributions are related to janitorial duties and I would like to contribute to implementing new features on the DRM or improving the DRM core.
Finally, by the end of GSoC, I’ll be joining another mentorship project on the Linux Graphics Stack, the Igalia Coding Experience, in which I will be learning more about the DRM subsystem and IGT in the next months. This is making me very excited, as I will continue to contribute with open source, especially the Linux kernel, with the help of my great mentors Melissa Wen and André Almeida, who are software engineers on Igalia.
First, I would like to thank my mentors Rodrigo Siqueira, Melissa Wen, and André Almeida. They really believed in our potential, encouraged us to talk to the community, and show us some great opportunities. They were an amazing team of mentors and I will always be thankful to them. Without them, I would probably never would had submitted a project to GSoC.
Also, I would like to thank the X.Org Foundation for accepting my proposal to GSoC and also helping us with funding for XDC 2022.
Moreover, I would like to thank AMD for donating hardware for us. During the project, I used a Radeon RX 5700 XT donated by them, so I’m also very thankful to them. Moreover, I would like to thank all AMD engineers that took their time to review my patches and send feedback.
Finally, I would like to thank the DRI community for reviewing my patches and giving me constructive feedback. Also, the KUnit community, especially David Gow, Daniel Latypov, and Brendan Higgins, review a lot of my patches and took their time to meet with us this summer.
Last, but not least, I thank the companionship of my colleagues Isabella Basso, Magali Lemes, and Tales Aparecida during this summer. It was great to have some companions to solve problems this summer and to share knowledge.
While Tianocore EDKII still dominates the UEFI development world, there has been continuous effort to enable Rust for firmware development. But so far the tools involved have not been stabilised. We now started an effort to remedy this and get stable Rust support for UEFI targets.
The rust compiler has gained support for multiple UEFI targets in the past, namely:
This allows building Rust UEFI Applications with a standard compiler by simply
passing --target <arch>-unknown-uefi to cargo or rustc. Unfortunately,
Tier-3
support means no compiler builds are distributed via the Rust release
channels, nor does the Rust-CI guarantee the targets build successfully.
Moreover, this implies that a nightly/unstable compiler is required to build
for those targets, even though no nightly Rust Language features are required.
Raising support of these targets to Tier-2 will include automatic toolchain builds distributed via Rust release channels. Hence, no nightly/unstable compiler is required, anymore. Automatic CI builds will guarantee the targets build successfully and do not randomly break. This will greatly improve the trust in the platform and significantly enhance the developer experience.
Rust support for UEFI has been documented in the rustc-book section UEFI Platform Support. You can follow and support the Major Change Proposal (MCP) to raise support to Tier-2 on the Rust Compiler-Team Tracker.
September 1 was a big day! The official cross-vendor Vulkan mesh shading extension that I teased a while ago, has now been officially released. This is a significant moment for me because I’ve spent considerable time making the RADV implementation and collaborated with some excellent people to help shape this extension in Khronos.
We first started talking about mesh shaders in Mesa about two years (maybe more?) ago.
At the time the only publicly available Vulkan mesh shading API was the vendor-specific
NV_mesh_shader made by NVidia.
I was working together with Christoph Kubisch (from NVidia) who helped understand what this topic is all about. Caio Oliveira and Marcin Slusarz (from Intel, working on ANV) joined the adventure too.
We made the decision to start working on some preliminary support for the NV extension to get some experience with the topic and learn how it’s supposed to work. Once we were satisfied with that, we made the jump to the EXT.
These are the common Mesa pieces that all drivers can use. The front-end and middleware code for mesh/task shader support are here. Caio created the initial pieces and I expanded on that as I found more and more things that needed adjustment in NIR, added a new storage class for task payloads etc. Marcin also chimed in with fixes and improvements.
AMD and Intel hardware work differently, so most of the hard
work couldn’t be shared and needed to be implemented in the backends.
However, some of the commonalities are implemented in eg. nir_lower_task_shader
for the work that needs to happen in both RADV and ANV.
There were dozens of merge requests that added support for various features,
cleaned up old features to make them not crash on mesh shaders, etc.
The latest is this MR
which adds all the remaining puzzle pieces for the EXT.
Because mesh shaders use NGG, the heavy lifting is done in ac_nir_lower_ngg
which is already responsible for other NGG shaders (VS, TES, GS).
The lowering basically “translates” the API shader to work like the HW expects.
Without going into much detail, it essentially wraps the application shader and replaces
some pieces of it to make them understandable by the HW.
There is now also an ac_nir_lower_taskmesh_io_to_mem
for translating task payload I/O and EmitMeshTasksEXT to something the HW can understand.
Previously I was mostly working on the compiler stack (NIR and ACO) and had little experience with the hardcore driver code, such as how draws/dispatches work and how the driver submits cmd buffers to the GPU. As I had near-zero knowledge of these areas, I had to learn about them, mostly by just reading the code.
So, I split the RADV work in two parts:
radv_cmd_buffer to add some new draw calls, and minor work in radv_pipeline
to figure out per-primitive output attributes and get the register programming right.radv_device because we now have to submit to multiple
queues at once. This is actually not finished yet because “gang submit” is still missing.
Additionally, radv_cmd_buffer needed heavy changes to support an internal compute cmdbuf.Naturally, during this work I also hit several RADV bugs in pre-existing use cases which just nobody noticed yet. Some of these were issues with secondary command buffers and conditional rendering on compute-only queues. There was also a nasty firmware bug, and other exciting stuff.
Let’s just say that my GPU loved to hang out with me.
The Intel ANV compiler backend and driver implementation were done by Caio and Marcin and I just want to take this opportunity to say that I really enjoyed working together with them.
All of the above would have been impossible if I didn’t have some solid test cases which I could throw at my implementation. Ricardo Garcia developed the CTS (Vulkan Conformance Test Suite) testcases for both NV_mesh_shader and EXT_mesh_shader. During that work, Ricardo wrote several thousand mesh and task shaders for us to test with. Ricardo if you’re reading this, THANK YOU!!!
Implementing VK_EXT_mesh_shader gave me a very good learning experience and helped me
get an understanding of parts of the driver that I had never looked at before.
We never wanted to officially support it, it was just a stepping stone for us to help start working on the EXT. The NV extension support will be removed soon.
The RADV and ANV support will be included once the system is updated to Mesa 22.3, though we may be convinced to bring it to the Deck sooner if somebody finds a game that uses mesh shaders.
For NVidia proprietary driver users, EXT_mesh_shader is already included in the latest beta drivers.
We marked mesh/task shader support “experimental” in RADV because it has one main caveat that we are unable to solve without kernel support. Thanks to how we need to submit to two different queues at the same time, this can deadlock your GPU if you are running two (or more) processes which use task shaders at the same time. To properly solve it we need the “gang submit” feature in the kernel which prevents such deadlocks.
Unfortunately “gang submit” is not upstream yet. Cross your fingers and let’s hope it’ll be included in Linux 6.1.
Until then, you can use the RADV_PERFTEST=ext_ms environment variable
to play your favourite mesh shader games!
Vulkan 1.3.226 was released yesterday and it finally includes the cross-vendor VK_EXT_mesh_shader extension. This has definitely been an important moment for me. As part of my job at Igalia and our collaboration with Valve, I had the chance to work reviewing this extension in depth and writing thousands of CTS tests for it. You’ll notice I’m listed as one of the extension contributors. Hopefully, the new tests will be released to the public soon as part of the open source VK-GL-CTS Khronos project.
During this multi-month journey I had the chance to work closely with several vendors working on adding support for this extension in multiple drivers, including NVIDIA (special shout-out to Christoph Kubisch, Patrick Mours, Pankaj Mistry and Piers Daniell among others), Intel (thanks Marcin Ślusarz for finding and reporting many test bugs) and, of course, Valve. Working for the latter, Timur Kristóf provided an implementation for RADV and reported to me dozens of bugs, test ideas, suggestions and improvements. Do not miss his blog post series about mesh shaders and how they’re implemented on RDNA2 hardware. Timur’s implementation will be used in your Linux system if you have a capable AMD GPU and, of course, the Steam Deck.
The extension has been developed with DX12 compatibility in mind. It’s possible to use mesh shading from Vulkan natively and it also allows future titles using DX12 mesh shading to be properly run on top of VKD3D-Proton and enjoyed on Linux, if possible, from day one. It’s hard to provide a summary of the added functionality and what mesh shaders are about in a short blog post like this one, so I’ll refer you to external documentation sources, starting by the Vulkan mesh shading post on the Khronos Blog. Both Timur and myself have submitted a couple of talks to XDC 2022 which have been accepted and will give you a primer on mesh shading as well as some more information on the RADV implementation. Do not miss the event at Minneapolis or enjoy it remotely while it’s being livestreamed in October.
A quick, off-hour post from me to share some exciting news in an unlikely area.
As of this moment, Mesa is now using the Mold linker in CI for faster build times.
If you haven’t tried Mold yet, you’re just pointlessly wasting your own time.
Thanks to everyone who works on Mold and everyone who helped get this change merged.
 Neverball rendered on the Apple M1 GPU with an open source OpenGL driver
After a year in development, the open source “Asahi” driver for the Apple GPU is running real games. There’s more to do, but Neverball is already playable (and a lot of fun!).
Neverball uses legacy “fixed function” OpenGL. Rather than supply programmable shaders like OpenGL 2, old OpenGL 1 applications configure a fixed set of graphics effects like fog and alpha testing. Modern GPUs don’t implement these features in hardware. Instead, the driver synthesizes shaders implementing the desired graphics. This translation is complicated, but we get it for “free” as an open source driver in Mesa. If we implement the modern shader pipeline, Mesa will handle fixed function OpenGL for us transparently. That’s a win for open source drivers, and a win for GPU acceleration on Asahi Linux.
To implement the modern OpenGL features, we rely on reverse-engineering the behaviour of Apple’s Metal driver, as we don’t have hardware documentation. Although Metal uses the same shader pipeline as OpenGL, it doesn’t support all the OpenGL features that the hardware does, which puts us in bind. In the past, I’ve relied on educated guesswork to bridge the gap, but there’s another solution… and it’s a doozy.
For motivation, consider the clip space used in OpenGL. In every other API on the planet, the Z component (depth) of points in the 3D world range from 0 to 1, where 0 is “near” and 1 is “far”. In OpenGL, however, Z ranges from negative 1 to 1. As Metal uses the 0/1 clip space, implementing OpenGL on Metal requires emulating the -1/1 clip space by inserting extra instructions into the vertex shader to transform the Z coordinate. Although this emulation adds overhead, it works for ANGLE’s open source implementation of OpenGL ES on Metal.
Like ANGLE, Apple’s OpenGL driver internally translates to Metal. Because Metal uses the 0 to 1 clip space, it should require this emulation code. Curiously, when we disassemble shaders compiled with their OpenGL implementation, we don’t see any such emulation. That means Apple’s GPU must support -1/1 clip spaces in addition to Metal’s preferred 0/1. The problem is figuring out how to use this other clip space.
We expect that there’s a bit toggling between these clip spaces. The logical place for such a bit is the viewport packet, but there’s no obvious difference between the viewport packets emitted by Metal and OpenGL-on-Metal. Ordinarily, we would identify the bit by toggling the clip space in Metal and comparing memory dumps. However, according to Apple’s documentation, there’s no way to change the clip space in Metal.
That’s an apparently contradiction. There’s no way to use the -1/1 clip space with Metal, but Apple’s OpenGL-on-Metal translator uses uses the -1/1 clip space. What gives?
Here’s a little secret: there are two graphics APIs called “Metal”. There’s the Metal you know, a limited API that Apple documents for App Store developers, an API that lacks useful features supported by OpenGL and Vulkan.
And there’s the Metal that Apple uses themselves, an internal API adding back features that Apple doesn’t want you using. While ANGLE implements OpenGL ES on the documented Metal, Apple can implement OpenGL on the secret Metal.
Apple does not publish documentation or headers for this richer Metal API, but if we’re lucky, we can catch a glimpse behind the curtain. The undocumented classes and methods making up the internal Metal API are still available in the production Metal binaries. To use them, we only need the missing headers. Fortunately, Objective-C symbols contain enough information to reconstruct header files, allowing us to experiment with undocumented methods with “extra” functionality inherited from OpenGL.
Compared to the desktop GPUs found in Intel Macs, Apple’s own GPU implements a slim, modern feature set mapping well to Metal. Most of the “extra” functionality is emulated. It is interesting to know the emulation happens in their Metal driver instead of their OpenGL frontend, but that’s unsurprising, as it allows their Metal drivers for Intel and AMD GPUs to implement the functionality natively. While this information is fascinating for “macOS hermeneutics”, it won’t help us with our Apple GPU mystery.
What will help us are the catch-all mystery methods named setOpenGLModeEnabled, apparently enabling “OpenGL mode”.
Mystery methods named like just beg to be called.
The render pipeline descriptor has such a method. That descriptor contains state that can change every draw. In some graphics APIs, like OpenGL with ARB_clip_control and Vulkan with VK_EXT_depth_clip_control, the application can change the clip space every draw. Ideally, the clip space state would be part of this descriptor.
We can test this optimistic guess by augmenting our Metal test bench to call [MTLRenderPipelineDescriptorInternal setOpenGLModeEnabled: YES].
It feels strange to call this hidden method. It’s stranger when the code compiles and runs just fine.
We can then compare traces between OpenGL mode and the normal Metal mode. Seemingly, enabling OpenGL mode toggles a plethora of random unknown bits. Even if one of them is what we want, it’s a bit unsatisfying that the “real” Metal would lack a proper [setClipSpace: MTLMinusOneToOne] method, rather than this blunt hack reconfiguring a pile of loosely related API behaviours.
Alas, for all the random changes in “OpenGL mode”, none seem to affect clipping behaviour.
Hope is not yet lost. There’s another setOpenGLModeEnabled method, this time in the render pass descriptor. Rather than pipeline state that can change every draw, this descriptor’s state can only change in between render passes. Changing that state in between draws would require an expensive flush to main memory, similar to the partial renders seen elsewhere with the Apple GPU. Nevertheless, it’s worth a shot.
Changing our test bench to call [MTLRenderPassDescriptorInternal setOpenGLModeEnabled: YES], we find another collection of random bits changed. Most of them are in hardware packets, and none of those seem to control clip space, either.
One bit does stand out. It’s not a hardware bit.
In addition to the packets that the userspace driver prepares for the hardware, userspace passes to the kernel a large block of render pass state describing everything from tile size to the depth/stencil buffers. Such a design is unusual. Ordinarily, GPU kernel drivers are only concerned with memory management and scheduling, remaining oblivious of 3D graphics. By contrast, Apple processes this state in the kernel forwarding the state to the GPU’s firmware to configure the actual hardware.
Comparing traces, the render pass “OpenGL mode” sets an unknown bit in this kernel-processed block. If we set the same bit in our OpenGL driver, we find the clip space changes to -1/1. Victory, right?
Almost. Because this bit is render pass state, we can’t use it to change the clip space between draws. That’s okay for baseline OpenGL and Vulkan, but it prevents us from efficiently implementing the ARB_clip_control and VK_EXT_depth_clip_control extensions. There are at least three (inefficient) implementations.
The first is ignoring the hardware support and emulating one of the clip spaces by inserting extra instructions into the vertex shader when the “wrong” clip space is used. In addition to extra overhead, that requires shader variants for the different clip spaces.
Shader variants are terrible.
In new APIs like Vulkan, Metal, and D3D12, everything needed to compile a shader is known up-front as part of a monolithic pipeline. That means pipelines are compiled when they’re created, not when they’re used, and are never recompiled. By contrast, older APIs like OpenGL and D3D11 allow using the same shader with different API states, requiring some drivers to recompile shaders on the fly. Compiling shaders is slow, so shader variants can cause unpredictable drops in an application’s frame rate, familiar to desktop gamers as stuttering. If we use this approach in our OpenGL driver, switching clip modes could cause stuttering due to recompiling shaders. In bad circumstances, that stutter could even happen long after the mode is switched.
That option is undesirable, so the second approach is always inserting emulation instructions that read the desired clip space at run-time, reserving a uniform (push constant) for the transformation. That way, the same shader is usable with either clip space, eliminating shader variants. However, that has even higher overhead than the first method. If an application frequently changes clip spaces within a render pass, this approach will be the most efficient of the three. If it does not, this approach adds constant overhead to every application. Knowing which approach is better requires the driver to have a magic crystal ball.1
The final option is using the hardware clip space bit and splitting the render pass when the clip space is changed. Here, the shaders are optimal and do not require variants. However, splitting the render pass wastes tremendous memory bandwidth if the application changes clip spaces frequently. Nevertheless, this approach has some support from the ARB_clip_control specification:
Some [OpenGL] implementations may introduce a flush when changing the clip control state. Hence frequent clip control changes are not recommended.
Each approach has trade-offs. For now, the easiest “option” is sticking our head in the sand and giving up on ARB_clip_control altogether. The OpenGL extension is optional until we get to OpenGL 4.5. Apple doesn’t implement it in their OpenGL stack. Because ARB_clip_control is primarily for porting Direct3D games, native OpenGL games are happy without it. Certainly, Neverball doesn’t mind. For now, we can use the hardware bit to use the -1/1 clip space unconditionally in OpenGL and 0/1 unconditionally in Vulkan. That does not require any emulation or flushing, though it prevents us from advertising the extensions.
That’s enough to run Neverball on macOS, using our userspace OpenGL driver in Mesa, and Apple’s proprietary kernel driver. There’s a catch: Neverball has to present with the deprecated X11 server on macOS. Years ago, Apple engineers2 contributed Mesa support for X11 on macOS (XQuartz), allowing us to run X11 applications with our Mesa driver. However, there’s no support for Apple’s own Cocoa windowing system, meaning native macOS applications won’t work with our driver. There’s also no easy way to run Linux’s newer Wayland display server on macOS. Nevertheless, Neverball does not use Cocoa directly. Instead, it uses the cross-platform SDL2 library to create its window, which internally uses Cocoa, X11, or Wayland as appropriate for the operating system. With enough sweat and tears, we can build an macOS/X11 version of SDL2 and link Neverball with that.
This Neverball/macOS/X11 port was frustrating, especially when the game is one apt install away on Linux. That’s a job for Asahi Lina, who has been hard at work writing a Linux kernel driver for Apple’s GPU. When our work converges, my userspace Mesa driver will run on Linux with her kernel driver to implement a full open source graphics stack for 3D acceleration on Asahi Linux.
Please temper your expectations: even with hardware documentation, an optimized Vulkan driver stack (with enough features to layer OpenGL 4.6 with Zink) requires many years of full time work. At least for now, nobody is working on this driver full time3. Reverse-engineering slows the process considerably. We won’t be playing AAA games any time soon.
That said, thanks to the tremendous shared code in Mesa, a basic OpenGL driver is doable by a single person. I’m optimistic that we’ll have native OpenGL 2.1 in Asahi Linux by the end of the year. That’s enough to accelerate your desktop environment and browser. It’s also enough to play older games (like Neverball). Even without fancy features, GPU acceleration means smooth animations and better battery life.
In that light, the Asahi Linux future looks bright.

I was planning to write this Friday, but then it was Friday, so I didn’t.
You know how it is.
I’ve been doing a lot of work on CPU optimizations in zink lately. I had planned to do some benchmarks of this, but now it’s Monday and someone has already done it for me, so I won’t.
Sometimes it’s like that too.
But the overly-technical, word-heavy, bullet-point-laden blog post still needs to be written, and now it’s Monday, so here I am.
Speed: How does it work?
I’ve blogged a lot about descriptors in the past. After years of pointlessly churning the codebase, a winner has emerged from the manager wars. Descriptor caching has been deleted. It’s gone, and laziness is the future. Huzzah.
To recap for those who haven’t followed however many treatises I’ve written on the topic, the idea of “lazy” descriptors is to do the least amount of work as stupidly as possible:
Simple, yet surprisingly performant.
We know that laziness is preferable to doing any kind of work. This is an indisputable fact. It’s also (obviously) true in CPU performance: less work is better. So how can zink do even less work than being lazy?
Well.
It’s always possible to be lazier.
Historically, there have been two points of non-laziness when it comes to lazy descriptors:
Descriptor sets are allocated from descriptor pools. Descriptor pools are allocated based on the pipeline layout. Pools are allocated onto the same struct that contains the cmdbuf, ensuring that the lifetimes match. Thus, for each pipeline layout, there are N descriptor pools, where N is the number of cmdbufs in use. Any time a new set must be allocated, the corresponding pool must be accessed. To access the the pool, the integer ID of the pipeline layout is used, as all the pools for a given cmdbuf are stored in a hash table.
Hash tables are slow. They require hashing, they require lookups, and why not just use an array if the key is already an integer? It’s a mystery, especially when there aren’t thousands of hash table entries, so I switched to using an array in order to enable direct lookups.
Performance: enhanced.
Descriptor set allocation was another bottleneck. In order to avoid blowing out heaps on heap-based hardware, I’ve capped descriptor pools to only contain 100 sets at a time. This means that even if a set isn’t fully utilized, it’s not consuming a huge amount of resources. It also means that allocation is faster when cmdbufs (and their associated descriptor pools) get reset.
Remember when I said that there were N descriptor pools for N cmdbufs? Obviously this was a lie. What I meant to say was there are N * O descriptor pools for N cmdbufs, where O is the number of times the descriptor pool has overflowed because it had to allocate more than 100 sets. In this scenario, the overflowed (full) descriptor pool is appended to an array which then gets freed upon cmdbuf reset. Since the pools are relatively small, this recycling operation is pretty fast.
But it’s still an operation. Which means it’s doing work. And you know what I hate? I mean, You know what CPU performance hates? Doing work. Yeah, that’s it.
So now instead of recycling these overflowed pools, zink just retains them and reuses them directly.

Performance: enhanced.
Join me in the next blog post when I show how it’s possible for anyone (even you!) to turn code into spaghetti using C++.
When I create kernel contributions, I usually rely on a specific hardware, which makes using a system on which I need to deploy kernels too complicated or time-consuming to be worth it. Yes, I'm an idiot that hacks the kernel directly on their main machine, though in my defense, I usually just need to compile drivers rather than full kernels.
But sometimes I work on a part of the kernel that can't be easily swapped out, like the USB sub-system. In which case I need to test out full kernels.
I usually prefer compiling full kernels as RPMs, on my Fedora system as it makes it easier to remove old test versions and clearly tag more information in the changelog or version numbers if I need to.
Step one, build as non-root
First, if you haven't already done so, create an ~/.rpmmacros file (I know...), and add a few lines so you don't need to be root, or write stuff in /usr to create RPMs.
$ cat ~/.rpmmacros
%_topdir /home/hadess/Projects/packages
%_tmppath %{_topdir}/tmp
Easy enough. Now we can use fedpkg or rpmbuild to create RPMs. Don't forget to run those under “powerprofilesctl launch” to speed things up a bit.
Step two, build less
We're hacking the kernel, so let's try and build from upstream. Instead of the aforementioned fedpkg, we'll use “make binrpm-pkg” in the upstream kernel, which builds the kernel locally, as it normally would, and then packages just the binaries into an RPM. This means that you can't really redistribute the results of this command, but it's fine for our use.
If you choose to build a source RPM using “make rpm-pkg”, know that this one will build the kernel inside rpmbuild, this will be important later.
Now that we're building from the kernel sources, that's our time to activate the cheat code. Run “make localmodconfig”. It will generate a .config file containing just the currently loaded modules. Don't forget to modify it to include your new driver, or driver for a device you'll need for testing.
Step three, build faster
If running “make rpm-pkg” is the same as running “make ; make modules” and then packaging up the results, does that mean that the “%{?_smp_mflags}” RPM macro is ignored, I make you ask rhetorically. The answer is yes. “make -j16 rpm-pkg”. Boom. Faster.
Step four, build fasterer
As we're building in the kernel tree locally before creating a binary package, already compiled modules and binaries are kept, and shouldn't need to be recompiled. This last trick can however be used to speed up compilation significantly if you use multiple kernel trees, or need to clean the build tree for whatever reason. In my tests, it made things slightly slower for a single tree compilation.
$ sudo dnf install -y ccache
$ make CC="ccache gcc" -j16 binrpm-pkg
Easy.
And if you want to speed up the rpm-pkg build:
$ cat ~/.rpmmacros
[...]
%__cc ccache gcc
%__cxx ccache g++
More information is available in Speeding Up Linux Kernel Builds With Ccache.
Step five, package faster
Now, if you've implemented all this, you'll see that the compilation still stops for a significant amount of time just before writing “Wrote kernel...rpm”. A quick look at top will show a single CPU core pegged to 100% CPU. It's rpmbuild compressing the package that you will just install and forget about.
$ cat ~/.rpmmacros
[...]
%_binary_payload w2T16.xzdio
More information is available in Accelerating Ceph RPM Packaging: Using Multithreaded Compression.
TL;DR and further work
All those changes sped up the kernel compilation part of my development from around 20 minutes to less than 2 minutes on my desktop machine.
$ cat ~/.rpmmacros
%_topdir /home/hadess/Projects/packages
%_tmppath %{_topdir}/tmp
%__cc ccache gcc
%__cxx ccache g++
%_binary_payload w2T16.xzdio
$ powerprofilesctl launch make CC="ccache gcc" -j16 binrpm-pkg
I believe there's still significant speed ups that could be done, in the kernel, by parallelising some of the symbols manipulation, caching the BTF parsing for modules, switching the single-threaded vmlinux bzip2 compression, and not generating a headers RPM (note: tested this last one, saves 4 seconds :)
The results of my tests. YMMV, etc.
| Command | Time spent | Notes |
|---|---|---|
| koji build --scratch --arch-override=x86_64 f36 kernel.src.rpm | 129 minutes | It's usually quicker, but that day must have been particularly busy |
| fedpkg local | 70 minutes | No rpmmacros changes except setting the workdir in $HOME |
| powerprofilesctl launch fedpkg local | 25 minutes | |
| localmodconfig / bin-rpmpkg | 19 minutes | Defaults to "-j2" |
| localmodconfig -j16 / bin-rpmpkg | 1:48 minutes | |
| powerprofilesctl launch localmodconfig ccache -j16 / bin-rpmpkg | 7 minutes | Cold cache |
| powerprofilesctl launch localmodconfig ccache -j16 / bin-rpmpkg | 1:45 minutes | Hot cache |
| powerprofilesctl launch localmodconfig xzdio -j16 / bin-rpmpkg | 1:20 minutes |
Hi all!
This month I’ve been pondering offline-first apps. The online aspect of modern apps is an important feature for many use-cases: it enables collaboration between multiple people and seamless transition between devices (e.g. I often switch between my personal workstation, my laptop, and my phone). However many modern apps come with a cost: often times they only work with a fixed proprietary server, and only work online. I think that for many use-cases, allowing users to pick their own open-source server instance and designing offline-friendly apps is a good compromise between freedom and ease-of-use/simplicity. Not to say that peer-to-peer or fully distributed apps are always a bad choice, but they come at a significantly higher complexity cost, which makes them more annoying to both build and use.
The main hurdle when writing an offline-first app is synchronization. All devices must have a local copy of the database for offline use, and they need to push changes to the server when the device comes online. Of course, it’s perfectly possible that changes were made on multiple devices while offline, so some kind of conflict resolution is necessary. Instead of presenting a “Oops, we’ve got a conflict, which version would you like to keep?” dialog to the user, it’d be much nicer to just Do The Right Thing™. CRDTs are a solution to that problem. They look a bit scary at first because of all of the obscure naming (PN-Counter? LWW-Element-Set? anyone?) and intimidating theory in papers. However I like to think of CRDTs as “use this one easy trick to make synchronization work well”, and not some kind of complicated abstract machinery. In other words, by following some simple rules, it’s not too difficult to write well-behaved synchronization logic.
So, long story short, I’ve been experimenting with CRDTs this month. To get some hands-on experience, I’ve started working on a small hacky group expense tracking app, seda. I’ve got the idea for this NPotM while realizing that there’s no existing good open-source user-friendly collaborative offline-capable (!) alternative yet. That said, it’s just a toy for now, nothing serious yet. If you want to play with it, you can have a look at the demo (feel free to toggle offline mode in the dev tools, then make some changes, then go online). There’s still a lot to be done: in particular, things gets a bit hairy when one device deletes a participant and another creates a transaction with that user at the same time. I plan to write some docs and maybe a blog post about my findings.
I’ve released two new versions of software I maintain. soju 0.5.0 adds support for push notifications, a new IRC extension to search the chat history, support for more IRCv3 extensions (some of which originate from soju itself), and many other enhancements. hut 0.2.0 adds numerous new commands and export functionality.
In graphics news, I’ve been working on small tasks in various projects. As part of my Valve contract, I’ve been investigating some DisplayPort MST issues in the core kernel DRM code, and I’ve introduced a function to unset layer properties in libliftoff. With the help of Petter Hutterer we’ve introduced a new X11 XWAYLAND extension as a more reliable way for clients to figure out whether they’re running under Xwayland. Last, I’ve continued ticking more boxes in libdisplay-info’s TODO list. We aren’t too far from having a complete EDID parser, but there are still so many extension blocks to add support for, and a whole new high-level API to design.
See you next month!
As of xorgproto 2022.2, we have a new X11 protocol extension. First, you may rightly say "whaaaat? why add new extensions to the X protocol?" in a rather unnecessarily accusing way, followed up by "that's like adding lipstick to a dodo!". And that's not completely wrong, but nevertheless, we have a new protocol extension to the ... [checks calendar] almost 40 year old X protocol. And that extension is, ever creatively, named "XWAYLAND".
If you recall, Xwayland is a different X server than Xorg. It doesn't try to render directly to the hardware, instead it's a translation layer between the X protocol and the Wayland protocol so that X clients can continue to function on a Wayland compositor. The X application is generally unaware that it isn't running on Xorg and Xwayland (and the compositor) will do their best to accommodate for all the quirks that the application expects because it only speaks X. In a way, it's like calling a restaurant and ordering a burger because the person answering speaks American English. Without realising that you just called the local fancy French joint and now the chefs will have to make a burger for you, totally without avec.
Anyway, sometimes it is necessary for a client (or a user) to know whether the X server is indeed Xwayland. Previously, this was done through heuristics: the xisxwayland tool checks for XRandR properties, the xinput tool checks for input device names, and so on. These heuristics are just that, though, so they can become unreliable as Xwayland gets closer to emulating Xorg or things just change. And properties in general are problematic since they could be set by other clients. To solve this, we now have a new extension.
The XWAYLAND extension doesn't actually do anything, it's the bare minimum required for an extension. It just needs to exist and clients only need to XQueryExtension or check for it in XListExtensions (the equivalent to xdpyinfo | grep XWAYLAND). Hence, no support for Xlib or libxcb is planned. So of all the nightmares you've had in the last 2 years, the one of misidentifying Xwayland will soon be in the past.
I’m going to kick off this post and month by saying that in my defense, I was going to write this post weeks ago, but then I didn’t, and then I got sidetracked, but I had the screenshots open the whole time so it’s not like I forgot, but then I did forget for a little while, and then my session died because the man the myth the legend the as-seen-on-the-web-with-a-different-meaning Adam “ajax” Jackson pranked me with a GLX patch, but I started a new session, and gimp recovered my screenshots, and I remembered I needed to post, and I got distracted even more, and now it’s like three whole weeks later and here we are at the post I was going to write last month but didn’t get around to but now it’s totally been gotten to.
You’re welcome.
There’s a new Mesa release in the pipeline, and its name is 22.2. Cool stuff happening in that release: Zink passes GL 4.6 conformance tests on Lavapipe and ANV, would totally pass on RADV if Mesa could even compile shaders for sparse texture tests, and is reasonably close to passing on NVIDIA’s beta driver except for the cases which don’t pass because of unfixed NVIDIA driver bugs. Also Kopper is way better. And some other stuff that I could handwave about but I’m too tired and already losing focus.
Recap over, now let’s get down to some technical mumbo-jumbo.
They exist in Vulkan, and I hate them, but I’m not talking specifically about VkRenderPass. Instead, I’m referring to the abstract concept of “render passes” which includes the better-in-every-way dynamic rendering variant.
Shut up, subpasses, nobody was talking to you.
Render passes control how rendering works. There’s load operations which determine how data is retrieved from the framebuffer (I also hate framebuffers) attachments, there’s store operations which determine how data is stored back to the attachments (I hate this part too), and then there’s “dependencies” (better believe I hate these) which manage synchronization between operations, and input attachments (everyone hates these) which enable reading attachment data in shaders, and then also render pass instances have to be started and stopped any time any attachments or framebuffer geometry changes (this sucks), and to top it all off, transfer operations can’t be executed while render passes are active (mega sucks).
Also there’s nested render passes, but I’m literally fearing for my life even mentioning them where other driver developers can see, so let’s move on.
Today’s suck is focused on render passes and transfer operations: why can’t they just get along?
Here’s a sample command stream from a bug I recently solved:

Notice how the command stream continually starts and stops render passes to execute transfer operations. If you’re on a desktop, you’re like whatever just give me frames, but if you’re on a mobile device with a tiling GPU, this is probably sending you sprinting for your Tik-Tok so you don’t have to look at the scary perf demons anymore.
Until recently, I would’ve been in the former camp, but guess what: as of Mesa 22.2, Zink on Turnip is Officially Supported. Not only that, it has only 14 failures for all of GL 4.6 conformance, so it can render stuff pretty accurately too. Given this as well as the rapid response from Turnip developers, it seems only right that some changes be made to improve Zink on tiling GPUs so that performance isn’t an unmitigated disaster (really hate when this happens).
When running on a tiling GPU, it’s important to avoid VK_ATTACHMENT_LOAD_OP_LOAD at all costs. These GPUs incur a penalty whenever they load attachment data, so ideally it’s best to either VK_ATTACHMENT_LOAD_OP_CLEAR or, for attachments without valid data, VK_ATTACHMENT_LOAD_OP_DONT_CARE. Failure to abide by this guideline will result in performance going straight to the dumpster (again, really hate this).
With this in mind, it may seem obvious, but the above command stream is terrible for tiling GPUs. Each render pass contains only a single draw before terminating to execute a transfer operation. Sure, an argument could be made that this is running a desktop GL application on mobile and thus any performance issues are expected, but I hate it when people argument.
Stop argumenting and get back to writing software.
Problem Space is a cool term used by real experts, so I can only imagine how much SEO using it twice gets me. In this Problem Space, none of the problem space problems that are spacing are new to people who have been in the problem space for longer than me, which is basically everyone since I only got to this problem space a couple years ago. Looking at Freedreno, there’s already a mechanism in place that I can copy to solve one problem Zink has, namely that of never using VK_ATTACHMENT_LOAD_OP_DONT_CARE.
Delving deeper into the problem space, use of VK_ATTACHMENT_LOAD_OP_DONT_CARE is predicated upon the driver being able to determine that a framebuffer attachment does not have valid data when beginning a render pass instance. Thus, the first step is to track that status on the image. It turns out there’s not many places where this needs to be managed. On write-map, import, and write operations, mark the image as valid, and if the image is explicitly invalidated, mark it as invalid. This flag can then be leveraged to skip loading attachment data where possible.
Problem spaced. Or at least one of them.
Historically, Zink has always been a driver of order. It gets the GL commands as Gallium callbacks, it records the corresponding Vulkan command, and then it sends the command buffer to the GPU. It’s simple, yet effective.
But what if there was a better way? What if Zink could see all these operations that were splitting the render passes and determine whether they needed to occur “now” or could instead occur “then”?
This is entirely possible, and it’s similar to the tracking for invalidation. Think of it like a sieve:
A and BA is the main command bufferB is for “unordered” commandsBAB before AIt sounds simple, but the details are a bit more complex. To handle this in Zink, I added more tracking data to each buffer and image resource such that:
B, the resources involved are tagged with the appropriate unordered read/write access flag(s)B if one of the following is true:
BA for the resource being written to AND ONE OF
BBy following this set of rules, transfer operations can be effectively filtered out of render passes on cmdbuf A and into the dumpster of cmdbuf B where all the other transfer operations live. Using a bit more creativity, the above command stream can be rewritten to look like this:

It’s not perfect, but it’s quite effective in not turning the driver code to spaghetti while yielding some nice performance boosts.
It’s also shipping along with the other changes in Mesa 22.2.
While both of these changesets solved real problems, there’s still work to be done in the future. Command stream reordering currently disallows moving draw and dispatch operations from A to B, but in some cases, this may actually be optimal. Finding a method to manage this could yield further gains in performance by avoiding more VK_ATTACHMENT_LOAD_OP_LOAD occurrences.
For those looking for a short answer: yes, it does.
Now, we can dive into a more elaborate answer.
Software engineering is a more systematic approach to software development, which involves the definition, implementation, measurement, management, change, and improvement of the software lifecycle. When we think about software through this lens, we must also think about software requirements, design, construction, testing, and maintenance.
Software engineering improves software maintainability, scalability, and security. Moreover, makes it easier to add testing to the software stack. This approach makes the software more robust.
A little glossary for some software engineering terms:
- Maintainability: how easy is it to repair, improve or understand a software artifact? After finishing your product, you must continue to fix bugs, optimize functionalities and refactor code to avoid future problems.
- Scalability: how easy is it to grow or shrink a software artifact?
- Testability: how easy is it to test a software artifact? Does the function has suitable hooks for testing?
Many people might believe that it is not possible to do software engineering on the Linux Kernel, or even that software engineering is not needed. From what I see, these beliefs come from two statements:
If we follow those beliefs, we might end up with poorly designed code. And, when badly designed code grows, I assure you that we are going to see code repetition, dead code, insanely large functions, and bugs.
But, the worst of all: when we have a huge codebase with lots of bad code practices, maintainability becomes hard and software quality will decrease more and more.
So, let’s first understand why those two beliefs are false.
You might say: how can I use my fancy design patterns, avoid code repetition, and make beautiful polymorphism when I don’t have classes?
And okay, you are right! Design Patterns in C++ are much easier and more natural to understand and implement. In C++ you can create a hierarchy to represent a family of devices, and this feature comes out of the box. But we can translate those concepts to C.
C is a structured language, but we can write object-oriented programs in C. In this sense, libraries and structs are your main allies. Moreover, you can use function pointers to create polymorphism in C.
For example, if I want to write a simple queue in C, I can use the following approach:
#ifndef QUEUE_H_
#define QUEUE_H_

typedef struct Queue Queue;
struct Queue {
	int *buffer;
	int head;
	int size;
	int tail;
	int (*isFull)(Queue* const me);
	int (*isEmpty)(Queue* const me);
	int (*getSize)(Queue* const me);
	void (*insert)(Queue* const me, int k);
	int (*remove)(Queue* const me);
};

/* Constructor and destructors */
void Queue_Init(Queue const me, (*isFullFunction)(Queue* const me),
	(*isEmptyFunction)(Queue* const me), (*getSizeFunction)(Queue* const me),
	(*insertFunction)(Queue* const me, int k), (*removeFunction)(Queue* const me));

void Queue_Cleanup(Queue* const me);

/* Operations */
int Queue_isFull(Queue* const me);
int Queue_isEmpty(Queue* const me);
int Queue_getSize(Queue* const me);
void Queue_insert(Queue* const me, int k);
int Queue_remove(Queue* const me);

Queue *Queue_Create(void);
void Queue_Destroy(Queue* const me);

#endif
Notice that I can have polymorphism using this approach. As I can create a new struct that inherits Queue, such as:
typedef struct CachedQueue CachedQueue;
struct CachedQueue {
	Queue *queue;

	/* new attributes */
	char name[80];
	int numberElementsOnDisk;

	/* aggregation in subclass */
	Queue *outputQueue;

	/* inherited virtual function */
	int (*isFull)(CachedQueue* const me);
	int (*isEmpty)(CachedQueue* const me);
	int (*getSize)(CachedQueue* const me);
	void (*insert)(CachedQueue* const me, int k);
	int (*remove)(CachedQueue* const me);

	/* new virtual functions */
	void (*flush)(CachedQueue* const me);
	int (*load)(CachedQueue* const me);
};
Okay, this is incredible! It is POLYMORPHISM in C. And there is much more on this topic in the book “Design Patterns for Embedded Systems in C”, by Bruce Powel Douglass. I love this book and I learned a lot from with it. Moreover, there is an awesome talk by Renato Geh and Matheus Tavares in the Linux Developer Conference Brazil 2019 about “Object Oriented Techniques in C: A Case Study on Git and Linux”.
So, you can see that fancy software architecture can be done on C. And don’t get me wrong, there are some beautiful abstractions in Linux that use these concepts, such as the Virtual File System (VFS). Moreover, some libraries provide great APIs, such as the DRM subsystem.
But sometimes this is not used in the implementation of drivers. And this takes us to the next point: yes, drivers need to be properly designed on the software side.
Here I must say that: my opinion is extremely biased by the Display Mode VBA library. For the last month, I have been writing unit tests for this library as part of my GSoC project. I got quite impressed (maybe not in a good way) with the amount of code repetition in the code and also with the huge functions.
And this is not a roast on AMDGPU code: AMD does a great job for the free software community and it is incredible that we have an open-source driver for a major graphics retailer. Moreover, I’m sure that this problem also exists in other parts of the kernel, so, I believe it is a good point to discuss.
Let’s start from the premise that drivers are finite: you can grab the datasheet, code the hardware to the end of its features and finish the driver. And I might even say that you are right: drivers are finite. But, hardware companies don’t usually create one single product with singular characteristics: they usually create a product line, and sometimes product lines have children: another product line with some upgrades on the previous one.
💡 Product lines having children… For an OOP programmer, this sounds like a beautiful case for inheritance.
So, if you have a product line, are you going to create a file for each product? And for the product with a couple of features added, are you going to paste the previous driver and change a couple of hundreds of lines? This doesn’t seem like a great option, for a couple of reasons:
You see, it all comes down to maintainability.
As a great example of code reuse, you can check out the IIO subsystem. Hardware manufacturers such as Maxim and Analog Devices Inc usually have chips that share the same register map or share functionalities. Instead of creating a driver for each chip, developers write one single driver and add the compatible device IDs on the Device Table. For example, you can check the Maxim MAX1027 ADC driver, which is compatible with the MAX1027, MAX1029, MAX1031, MAX1227, MAX1229, and MAX1231. So we have one single driver for six devices: this is great for maintainability!
In this case, if I find a bug, I can make one single modification, and send one single patch, the maintainer will review one single time, and all runs smoothly.
Now, let’s take a look at the DML folder from the AMD’s Display Core, more
specifically the display_mode_vba files from DCN20 and DCN21. See that
these product lines are pretty similar, so maybe we can reuse a lot of the
code.
But, if you check the directory, you can see that we have three different
files: display_mode_vba_20.c, display_mode_vba_20v2.c and
display_mode_vba_21.c.
💡 You can check the difference between the files through:
$ diff drivers/gpu/drm/amd/display/dc/dml/dcn20/display_mode_vba_20.c drivers/gpu/drm/amd/display/dc/dml/dcn20/display_mode_vba_20v2.c
And much of the code is identical: I mean there are functions that don’t change a line! This hits pretty hard on maintainability.
Now, if I find a bug, I need to make three modifications. Moreover, I might not even know that the code is duplicated, so I might only fix the bug in one place and leave the other files untouched. Then another developer might find the same bug once again, and will have to send it to the maintainer, who will have to review it one more time. This is a lot of rework!
And if I could guess a reason for AMD to copy and paste the code so many times, I would point out another maintainability issue: the functions are huge! Some functions from the VBA files have more than a thousand lines.
These huge functions from the VBA files implicate that if you want to change a couple of lines for your new product lines you need to copy and paste the whole function.
Ideally, from the principles of the Clean Code book, we would like to have small functions that should be simple and do one thing only. And I know: this is not applicable in 100% of the cases, but I cannot find a good reason for a function to be so huge and have dozens of parameters.
💡 Other than the readability, those huge functions also hurt the stack pretty badly.
Huge functions really hurt the readability, understandability, and testability of the code. Moreover, they make it difficult to avoid code duplication as the function has dozens of side effects.
More glossary for some software engineering terms:
- Readability: how easily a software artifact can be read?
- Understandability: how easily a software artifact can be comprehend?
But this is not a dead end for the AMDGPU’s DML code: I mean, the AMDGPU driver works awesomely on Linux, and code refactoring is always an option.
At this moment, we might conclude that as the AMDGPU driver is open-source, then we can fix those issues in the code. But it is definitely not safe to simply tear down the code and rewrite it in one single patch set, as the AMDGPU driver has to remain functional on Linux.
One way to fix this is through unit testing to ensure the code is properly refactored. Though, throughout my GSoC project, I ended up noticing that it is not possible to write a unit test for a thousand-line function. A huge function has many side effects and testing each one of them is not feasible.
Maybe for Display Mode VBA unit testing is not the only way to go. We probably could first break the functions into smaller, self-contained pieces, as this will help to create better tests, to improve readability, and to reduce the stack size.
Now with smaller functions, it is more feasible to share code across the DCNs and create a common interface for them.
This refactor can lead to the use of those design patterns I talked about earlier and make the DML more maintainable and readable. We can think about the use of inheritance where we have a base library, from which DCN20 can extend, and then DCN21 can extend from DCN20. And this is how those three huge files can become three small files.
And this refactor can start piece by piece:
This way we can make a safer refactor as unit testing is not viable. This doesn’t mean that we are not going to introduce any bugs in the process, but having a structured plan will help us avoid them.
I must say: this is the opinion of someone that came straight out of the university, thinking about well-structured code. So, I might be utopian about software engineering. I understand that the developers at AMD are doing their best and are working hard to provide the best features for us, Linux users.
But thinking of software is the best way to ensure the maintainability of our code, and bad code practices will prove costly one day or another.
Over the weekend, I asked on twitter if people would be interested in a rant about descriptor sets. As of the writing of this post, it has 46 likes so I’ll count that as a yes.
I kind-of hate descriptor sets…
Well, not descriptor sets per se. More descriptor set layouts. The fundamental problem, I think, was that we too closely tied memory layout to the shader interface. The Vulkan model works ok if your objective is to implement GL on top of Vulkan. You want 32 textures, 16 images, 24 UBOs, etc. and everything in your engine fits into those limits. As long as they’re always separate bindings in the shader, it works fine. It also works fine if you attempt to implement HLSL SM6.6 bindless on top of it. Have one giant descriptor set with all resources ever in giant arrays and pass indices into the shader somehow as part of the material.
The moment you want to use different binding interfaces in different shaders (pretty common if artists author shaders), things start to get painful. If you want to avoid excess descriptor set switching, you need multiple pipelines with different interfaces to use the same set. This makes the already painful situation with pipelines worse. Now you need to know the binding interfaces of all pipelines that are going to be used together so you can build the combined descriptor set layout and you need to know that before you can compile ANY pipelines. We tried to solve this a bit with multiple descriptor sets and pipeline layout compatibility which is supposed to let you mix-and-match a bit. It’s probably good enough for VS/FS mixing but not for mixing whole materials.
So, how did we get here? As with most things in Vulkan, a big part of the problem is that Vulkan targets a very diverse spread of hardware and everyone does descriptor binding a bit differently. In order to understand the problem space a bit, we need to look at the hardware…
DISCLAIMER:
I’m about to spill a truckload of hardware beans. Let me reassure you all that I am not violating any NDAs here. Everything I’m about to tell you is either publicly documented (AMD and Intel) or can be gleaned from reading public Mesa source code.
Descriptor binding methods in hardware can be roughly broken down into 4 broad categories, each with its own advantages and disadvantages:
Direct access (D): This is where the shader passes the entire descriptor to the access instruction directly. The descriptor may have been loaded from a buffer somewhere but the shader instructions do not reference that buffer in any way; they just take what they’re given. The classic example here is implementing SSBOs as “raw” pointer access. Direct access is extremely flexible because the descriptors can live literally anywhere but it comes at the cost of having to pass the full descriptor through the shader every time.
Descriptor buffers (B): Instead of passing the entire descriptor through the shader, descriptors live in a buffer. The buffers themselves are bound to fixed binding points or have their base addresses pushed into the shader somehow. The shader instruction takes either a fixed descriptor buffer binding index or a base address (as appropriate) along with some form of offset to the descriptor in the buffer. The difference between this and the direct access model is that the descriptor data lives in some other bit of memory that the hardware must first read before it can do the actual access. Changing buffer bindings, while definitely not free, is typically not incredibly expensive.
Descriptor heaps (H): Descriptors of a particular type all live in a single global table or heap. Because the table is global, changing it typically involves a full GPU stall and maybe dumping a bunch of caches. This makes changing out the table fairly expensive. Shader instructions which access these descriptors are passed an index into the global table. Because everything is fixed and global, this requires the least amount of data to pass through the shader of the three bindless mechanisms.
Fixed HW bindings (F): In this model, resources are bound to fixed HW slots, often by setting registers from the command streamer or filling out small tables in memory. With the push towards bindless, fixed HW bindings are typically only used for fixed-function things on modern hardware such as render targets and vertex, index, and streamout buffers. However, we still need to consider them because Vulkan 1.0 was designed to support pre-bindless hardware which might not be quite as nice.
Here’s a quick run-down on where things sit with most of the hardware shipping today:
| Hardware | Textures | Images | Samplers | Border Colors | Typed buffers | UBOs | SSBOs |
|---|---|---|---|---|---|---|---|
| NVIDIA (Kepler+) | H | H | H | H | D/F | D | |
| AMD | D | D | D | H | D | D | D |
| Intel (Skylake+) | H | H | H | H | H/D/F | H/D | |
| Intel (pre-Skylake) | F | F | F | F | D/F | F | |
| Arm (Valhal+) | B | B | B | B | B/D/F | B/D | |
| Arm (Pre-Valhal) | F | F | F | F | D/F | D | |
| Qualcomm (a5xx+) | B | B | B | B | B | B | |
| Broadcom (vc5) | D | D | D | D | D | D |
The line above for “Intel (pre-Skylake)” is a bit misleading. I’m labeling everything as fixed HW bindings but it’s actually a bit more flexible than most fixed HW binding mechanisms. It a sort of heap model but where, instead of indexing into heaps directly from the shader, everything goes through a second layer of indirection called a binding table which is restricted to 240 entries. On Skylake and later hardware, the binding table hardware still exists and uses a different set up heaps which provides a nice back-door for drivers. More on that when we talk about D3D12.
As you can see from above, the hardware landscape is quite diverse when it comes to descriptor binding. Everyone has made slightly different choices depending on the type of descriptor and picking a single model for everyone isn’t easy. The Vulkan answer to this was, of course, descriptor sets and their dreaded layouts.
Ignoring UBOs for the moment, the mapping from the Vulkan API to these hardware descriptors is conceptually fairly simple. The descriptor set layout describe a set of bindings, each with a binding type and a number of descriptors in that binding. The driver maps the binding type to the type of HW binding it uses and computes how much GPU or CPU memory is needed to store all the bindings. Fixed HW bindings are typically stored CPU-side and the actual bindings get set as part of vkCmdBindDescriptorSets() or vkCmdDraw/Dispatch(). For everything in one of the three bindless categories, they allocate GPU memory. For heap descriptors, descriptors may be allocated as part of the descriptor set or, to save memory, as part of the image or buffer view object. Given that descriptor heaps are often limited in size, allocating them as part of the view object is often preferred.
UBOs get weird. I’m not going to try and go into all of the details because there are often heuristics involved and it gets complicated fast. However, as you can see from the above table, most hardware has some sort of fixed HW binding for UBOs, even on bindless hardware. This is because UBOs are the hottest of hot paths and even small differences in UBO fetch speed turn into real FPS differences in games. This is why, even with descriptor indexing, UBOs aren’t required to support update-after-bind. The Intel Linux driver has three or four different paths a UBO may take based on how often it’s used relative to other UBOs, update-after-bind, and which shader stage it’s being accessed from.
The other thing I have yet to mention is dynamic buffers. These typically look like a fixed HW binding. How they’re implemented varies by hardware and driver. Often they use fixed HW bindings or the descriptors are loaded into the shader as push constants. Even if the buffer pointer comes from descriptor set memory, the dynamic offset has to get loaded in via some push-like mechanism.
DISCLAIMER:
Again, I’m going to talk details here. Again, in spite of the fact that there are exactly zero open-source D3D12 drivers, I can safely say that I’m not violating any NDAs. I’ve literally never seen the inside of a D3D12 driver. I’ve just read public documentation and am familiar with how hardware works and is driven. This is all based on D3D12 drivers I’ve written in my head, not the real deal. I may get a few things wrong.
For D3D12, Microsoft took a very different approach. They embraced heaps. D3D12 has these heavy-weight descriptor heap objects which have to be bound before you can execute any 3D or compute commands. Shaders have the usual HLSL register notation for describing the descriptor interface. When shaders are compiled into pipelines, descriptor tables are used to map the bindings in the shader to ranges in the relevant descriptor heap. While the size of a descriptor heap range remains fixed, each such range has a dynamic offset which allows the application to move it around at will.
With SM6.6, Microsoft added significant flexibility and further embraced heaps. Now, instead of having to use descriptor tables in the root descriptor, applications can use heap indices directly. This provides a full bindless experience. All the application developer has to do is manage heap allocations with resource lifetimes and figure out how to get indices into their shader. Gone are the days of fiddling with fixed interface layouts through side-bind pipeline create APIs. From what I’ve heard, most developers love it.
If D3D12 has embraced heaps, how does it work on AMD? They use descriptor buffers, don’t they? Yup. But, fortunately for Microsoft, a descriptor heap is just a very restrictive descriptor buffer. The AMD driver just uses two of their descriptor buffer bindings (resource and sampler heaps are separate in D3D12) and implements the heap as a descriptor buffer.
One downside to the descriptor heap approach is that it forces some amount of extra indirection, especially with the SM6.6 bindless model. If your application is using bindless, you first have to load a heap index from a constant buffer somewhere and then pass that to the load/store op. The load/store turns into a sequence of instruction that fetches the descriptor from the heap, does the offset calculation, and then does the actual load or store from the corresponding pointer. Depending on how often the shader does this, how many unique descriptors are involved, and the compiler’s ability to optimize away redundant descriptor fetches, this can add up to real shader time in a hurry.
The other major downside to the D3D12 model is that handing control of the hardware heaps to the application really ties driver writers’ hands. Any time the client does a copy or blit operation which isn’t implemented directly in the DMA hardware, the driver has to spin up the 3D hardware, set up a pipeline, and do a few draws. In order to do a blit, the pixel shader needs to be able to read from the blit source image. This means it needs a texture or UAV descriptor which needs to live in the heap which is now owned by the client. On AMD, this isn’t a problem because they can re-bind descriptor sets relatively cheaply or just use one of the high descriptor set bindings which they’re not using for heaps. On Intel, they have the very convenient back-door I mentioned above where the old binding table hardware still exists for fragment shaders.
Where this gets especially bad is on NVIDIA, which is a bit ironic given that the D3D12 model is basically exactly NVIDIA hardware. NVIDIA hardware only has one texture/image heap and switching it is expensive. How do they implement these DMA operations, then? First off, as far as I can tell, the only DMA operation in D3D12 that isn’t directly supported by NVIDIA’s DMA engine is MSAA resolves. D3D12 doesn’t have an equivalent of vkCmdBlitImage(). Applications are told to implement that themselves if they really want it. What saves them, I think (I can’t confirm), is that D3D12 exposes 106 descriptors to the application but NVIDIA hardware supports 220 descriptors. That leaves about 48k descriptors for internal usage. Some of those are reserved by Microsoft for tools such as PIX but I’m guessing a few of them are reserved for the driver as well. As long as the hardware is able to copy descriptors around a bit (NVIDIA is very good at doing tiny DMA ops), they can manage their internal descriptors inside this range. It’s not ideal, but it does work.
I have nothing to announce but me and others have been thinking about descriptors in Vulkan and how to make them better. I think we should be able to do something that’s better than the descriptor sets we have today. What is that? I’m personally not sure yet.
The good news is that, if we’re willing to ignore non-bindless hardware (I think we are for forward-looking things), there are really only two models: heaps and buffers. (Anything direct access can be stored in the heap or buffer and it won’t hurt anything.) I too can hear the siren call of D3D12 heaps but I’d really like to avoid tying the drivers hands like that. Even if NVIDIA were to rework their hardware to support two heaps today to get around the internal descriptors problem and make it part of the next generation of GPUs, we wouldn’t be able to rely on users having that for 5-10 years, longer depending on application targets.
If we keep letting drivers managing their own heaps, D3D12 layering on top of Vulkan becomes difficult. D3D12 doesn’t have image or buffer view objects in the same sense that Vulkan does. You just create descriptors and stick them in the heap somewhere. This means we either need to come up with a way to get rid of view objects in Vulkan or a D3D12 layer needs a giant cache of view objects, the lifetimes if which are difficult to manage to say the least. It’s quite the pickle.
As with many of my rant posts, I don’t really have a solution. I’m not even really asking for feedback and ideas. My primary goal is to educate people and help them understand the problem space. Graphics is insanely complicated and hardware vendors are notoriously cagey about the details. I’m hoping that, by demystifying things a bit, I can at the very least garner a bit of sympathy for what we at Khronos are trying to do and help people understand that it’s a near miracle that we’ve gotten where we are. 😅
The first part of this series covered principles of locking engineering. This part goes through a pile of locking patterns and designs, from most favourable and easiest to adjust and hence resulting in a long term maintainable code base, to the least favourable since hardest to ensure it works correctly and stays that way while the code evolves. For convenience even color coded, with the dangerous levels getting progressively more crispy red indicating how close to the burning fire you are! Think of it as Dante’s Inferno, but for locking.
As a reminder from the intro of the first part, with locking engineering I mean
the art of ensuring that there’s sufficient consistency in reading and
manipulating data structures, and not just sprinkling mutex_lock()
and mutex_unlock() calls around until the result looks reasonable
and lockdep has gone quiet.
The dumbest possible locking is no need for locking at all. Which does not mean
extremely clever lockless tricks for a “look, no calls to
mutex_lock()” feint, but an overall design which guarantees that
any writers cannot exist concurrently with any other access at all. This
removes the need for consistency guarantees while accessing an object at the
architectural level.
There’s a few standard patterns to achieve locking nirvana.
The lesson in graphics API design over the last decade is that immutable state objects rule, because they both lead to simpler driver stacks and also better performance. Vulkan instead of the OpenGL with it’s ridiculous amount of mutable and implicit state is the big example, but atomic instead of legacy kernel mode setting or Wayland instead of the X11 are also built on the assumption that immutable state objects are a Great Thing (tm).
The usual pattern is:
A single thread fully constructs an object, including any sub structures and
anything else you might need. Often subsystems provide initialization helpers for
objects that driver can subclass through embedding, e.g.
drm_connector_init() for initializing a kernel modesetting output
object. Additional functions can set up different or optional aspects of an
object, e.g. drm_connector_attach_encoder() sets up the invariant
links to the preceding element in a kernel modesetting display chain.
The fully formed object is published to the world, in the kernel this often
happens by registering it under some kind of identifier. This could be a global
identifier like register_chrdev() for character devices, something attached to a device like
registering a new display output on a driver with
drm_connector_register() or some struct xarray in the
file private structure. Note that this step here requires memory barriers of
some sort. If you hand roll the data structure like a list or lookup
tree with your own fancy locking scheme instead of using existing standard
interfaces you are on a fast path to level 3 locking hell. Don’t do that.
From this point on there are no consistency issues anymore and all threads can access the object without any locking.
Another way to ensure there’s no concurrent access is by only allowing one thread to own an object at a given point of time, and have well defined handover points if that is necessary.
Most often this pattern is used for asynchronously processing a userspace request:
The syscall or IOCTL constructs an object with sufficient information to process the userspace’s request.
That object is handed over to a worker thread with e.g.
queue_work().
The worker thread is now the sole owner of that piece of memory and can do whatever it feels like with it.
Again the second step requires memory barriers, which means if you hand roll
your own lockless queue you’re firmly in level 3 territory and won’t get rid of
the burned in red hot afterglow in your retina for quite some time. Use standard
interfaces like struct completion or even better libraries like the
workqueue subsystem here.
Note that the handover can also be chained or split up, e.g. for a nonblocking atomic kernel modeset requests there’s three asynchronous processing pieces involved:
The main worker, which pushes the display state update to the hardware and
which is enqueued with queue_work().
The userspace completion event handling built around struct
drm_pending_event and generally handed off to the interrupt handler of
the driver from the main worker and processed in the interrupt handler.
The cleanup of the no longer used old scanout buffers from the preceding
update. The synchronization between the preceding update and the cleanup is
done through struct completion to ensure that there’s only ever a
single worker which owns a state structure and is allowed to change it.
Users generally don’t appreciate if the kernel leaks memory too much, and cleaning up objects by freeing their memory and releasing any other resources tends to be an operation of the very much mutable kind. Reference counting to the rescue!
Every pointer to the reference counted object must guarantee that a reference
exists for as long as the pointer is in use. Usually that’s done by calling
kref_get() when making a copy of the pointer, but implied
references by e.g. continuing to hold a lock that protects a different pointer
are often good enough too for a temporary pointer.
The cleanup code runs when the last reference is released with
kref_put(). Note that this again requires memory barriers to work
correctly, which means if you’re not using struct kref then it’s
safe to assume you’ve screwed up.
Note that this scheme falls apart when released objects are put into some kind
of cache and can be resurrected. In that case your cleanup code needs to somehow
deal with these zombies and ensure there’s no confusion, and vice versa any code
that resurrects a zombie needs to deal the wooden spikes the cleanup code might
throw at an inopportune time. The worst example of this kind is
SLAB_TYPESAFE_BY_RCU, where readers that are only protected with
rcu_read_lock() may need to deal with objects potentially going
through simultaneous zombie resurrections, potentially multiple times, while
the readers are trying to figure out what is going on. This generally leads to
lots of sorrow, wailing and ill-tempered maintainers, as the GPU subsystem
has and continues to experience with struct dma_fence.
Hence use standard reference counting, and don’t be tempted by the siren of trying to implement clever caching of any kind.
It would be great if nothing ever changes, but sometimes that cannot be avoided. At that point you add a single lock for each logical object. An object could be just a single structure, but it could also be multiple structures that are dynamically allocated and freed under the protection of that single big dumb lock, e.g. when managing GPU virtual address space with different mappings.
The tricky part is figuring out what is an object to ensure that your lock is neither too big nor too small:
If you make your lock too big you run the risk of creating a dreaded subsystem lock, or violating the “Protect Data, not Code” principle in some other way. Split your locking further so that a single lock really only protects a single object, and not a random collection of unrelated ones. So one lock per device instance, not one lock for all the device instances in a driver or worse in an entire subsystem.
The trouble is that once a lock is too big and has firmly moved into “protects some vague collection of code” territory, it’s very hard to get out of that hole.
Different problems strike when the locking scheme is too fine-grained, e.g. in the GPU virtual memory management example when every address mapping in the big vma tree has its own private lock. Or when a structure has a lot of different locks for different member fields.
One issue is that locks aren’t free, the overhead of fine-grained locking can seriously hurt, especially when common operations have to take most of the locks anyway and so there’s no chance of any concurrency benefit. Furthermore fine-grained locking leads to the temptation of solving locking overhead with ever more clever lockless tricks, instead of radically simplifying the design.
The other issue is that more locks improve the odds for locking inversions, and those can be tough nuts to crack. Again trying to solve this with more lockless tricks to avoid inversions is tempting, and again in most cases the wrong approach.
Ideally, your big dumb lock would always be right-sized everytime the requirements on the datastructures changes. But working magic 8 balls tend to be on short supply, and you tend to only find out that your guess was wrong when the pain of the lock being too big or too small is already substantial. The inherent struggles of resizing a lock as the code evolves then keeps pushing you further away from the optimum instead of closer. Good luck!
It would be great if this is all the locking we ever need, but sometimes there’s functional reasons that force us to go beyond the single lock for each logical object approach. This section will go through a few of the common examples, and the usual pitfalls to avoid.
But before we delve into details remember to document in kerneldoc with the inline per-member kerneldoc comment style once you go beyond a simple single lock per object approach. It’s the best place for future bug fixers and reviewers - meaning you - to find the rules for how at least things were meant to work.
One of the main duties of the kernel is to track everything, least to make sure there’s no leaks and everything gets cleaned up again. But there’s other reasons to maintain lists (or other container structures) of objects.
Now sometimes there’s a clear parent object, with its own lock, which could also protect the list with all the objects, but this does not always work:
It might force the lock of the parent object to essentially become a subsystem lock and so protect much more than it should when following the “Protect Data, not Code” principle. In that case it’s better to have a separate (spin-)lock just for the list to be able to clearly untangle what the parent and subordinate object’s lock each protect.
Different code paths might need to walk and possibly manipulate the list both from the container object and contained object, which would lead to locking inversion if the list isn’t protected by it’s own stand-alone (nested) lock. This tends to especially happen when an object can be attached to multiple other objects, like a GPU buffer object can be mapped into multiple GPU virtual address spaces of different processes.
The constraints of calling contexts for adding or removing objects from the list could be different and incompatible from the requirements when walking the list itself. The main example here are LRU lists where the shrinker needs to be able to walk the list from reclaim context, whereas the superior object locks often have a need to allocate memory while holding each lock. Those object locks the shrinker can then only trylock, which is generally good enough, but only being able to trylock the LRU list lock itself is not.
Simplicity should still win, therefore only add a (nested) lock for lists or other container objects if there’s really no suitable object lock that could do the job instead.
Another example that requires nested locking is when part of the object is manipulated from a different execution context. The prime example here are interrupt handlers. Interrupt handlers can only use interrupt safe spinlocks, but often the main object lock must be a mutex to allow sleeping or allocating memory or nesting with other mutexes.
Hence the need for a nested spinlock to just protect the object state shared between the interrupt handler and code running from process context. Process context should generally only acquire the spinlock nested with the main object lock, to avoid surprises and limit any concurrency issues to just the singleton interrupt handler.
Very similar to the interrupt handler problems is coordination with async workers. The best approach is the single owner pattern, but often state needs to be shared between the worker and other threads operating on the same object.
The naive approach of just using a single object lock tends to deadlock:
start_processing(obj)
{
	mutex_lock(&obj->lock);
	/* set up the data for the async work */;
	schedule_work(&obj->work);
	mutex_unlock(&obj->lock);
}

stop_processing(obj)
{
	mutex_lock(&obj->lock);
	/* clear the data for the async work */;
	cancel_work_sync(&obj->work);
	mutex_unlock(&obj->lock);
}

work_fn(work)
{
	obj = container_of(work, work);

	mutex_lock(&obj->lock);
	/* do some processing */
	mutex_unlock(&obj->lock);
}
Do not worry if you don’t spot the deadlock, because it is a cross-release
dependency between the entire work_fn() and
cancel_work_sync() and these are a lot trickier to spot. Since
cross-release dependencies are a entire huge topic on themselves I won’t go into
more details, a good starting point is this LWN
article.
There’s a bunch of variations of this theme, with problems in different scenarios:
Replacing the cancel_work_sync() with cancel_work()
avoids the deadlock, but often means the work_fn() is prone to
use-after-free issues.
Calling cancel_work_sync()before taking the mutex can work in
some cases, but falls apart when the work is self-rearming. Or maybe the
work or overall object isn’t guaranteed to exist without holding it’s lock,
e.g. if this is part of an async processing queue for a parent structure.
Cancelling the work after the call to mutex_unlock() might race
with concurrent restarting of the work and upset the bookkeeping.
Like with interrupt handlers the clean solution tends to be an additional nested
lock which protects just the mutable state shared with the work function and
nests within the main object lock. That way work can be cancelled while the main
object lock is held, which avoids a ton of races. But without holding the
sublock that work_fn() needs, which avoids the deadlock.
Note that in some cases the superior lock doesn’t need to exist, e.g.
struct drm_connector_state is protected by the single
owner pattern, but drivers might have some need
for some further decoupled asynchronous processing, e.g. for handling the
content protect or link training machinery. In that case only the sublock for
the mutable driver private state shared with the worker exists.
Reference counting is a great pattern, but sometimes you need be able to store pointers without them holding a full reference. This could be for lookup caches, or because your userspace API mandates that some references do not keep the object alive - we’ve unfortunately committed that mistake in the GPU world. Or because holding full references everywhere would lead to unreclaimable references loops and there’s no better way to break them than to make some of the references weak. In languages with a garbage collector weak references are implemented by the runtime, and so no real worry. But in the kernel the concept has to be implemented by hand.
Since weak references are such a standard pattern struct kref has
ready-made support for them. The simple approach is using
kref_put_mutex() with the same lock that also protects the
structure containing the weak reference. This guarantees that either the weak
reference pointer is gone too, or there is at least somewhere still a strong
reference around and it is therefore safe to call kref_get(). But
there are some issues with this approach:
It doesn’t compose to multiple weak references, at least if they are protected
by different locks - all the locks need to be taken before the final
kref_put() is called, which means minimally some pain with lock
nesting and you get to hand-roll it all to boot.
The mutex required to be held during the final put is the one which protects the structure with the weak reference, and often has little to do with the object that’s being destroyed. So a pretty nasty violation of the big dumb lock pattern. Furthermore the lock is held over the entire cleanup function, which defeats the point of the reference counting pattern, which is meant to enable “no locking” cleanup code. It becomes very tempting to stuff random other pieces of code under the protection of this look, making it a sprawling mess and violating the principle to protect data, not code: The lock held during the entire cleanup operation is protecting against that cleanup code doing things, and not anymore a specific data structure.
The much better approach is using kref_get_unless_zero(), together
with a spinlock for your data structure containing the weak reference. This
looks especially nifty in combination with struct xarray.
obj_find_in_cache(id)
{
	xa_lock();
	obj = xa_find(id);
	if (!kref_get_unless_zero(&obj->kref))
		obj = NULL;
	xa_unlock();

	return obj;
}
With this all the issues are resolved:
Arbitrary amounts of weak references in any kind of structures protected by their own spinlock can be added, without causing dependencies between them.
In the object’s cleanup function the same spinlock only needs to be held right around when the weak references are removed from the lookup structure. The lock critical section is no longer needlessly enlarged, we’re back to protecting data instead of code.
With both together the locking does no longer leak beyond the lookup structure
and it’s associated code any more, unlike with kref_put_mutex() and
similar approaches. Thankfully kref_get_unless_zero() has become
the much more popular approach since it was added 10 years ago!
We’ve now seen a few examples where the “no locking” patterns from level 0 collide in annoying ways when more locking is added to the point where we seem to violate the principle to protect data, not code. It’s worth to look at this a bit closer, since we can generalize what’s going on here to a fairly high-level antipattern.
The key insight is that the “no locking” patterns all rely on memory barrier
primitives in disguise, not classic locks, to synchronize access between
multiple threads. In the case of the single owner
pattern there might also be blocking semantics
involved, when the next owner needs to wait for the previous owner to finish
processing first. These are functions like flush_work() or the
various wait functions like wait_event() or
wait_completion().
Calling these barrier functions while holding locks commonly leads to issues:
Blocking functions like flush_work() pull in every lock or other
dependency the work we wait on, or more generally, any of the previous owners
of an object needed as a so called cross-release dependency. Unfortunately
lockdep does not understand these natively, and the usual tricks to add manual
annotations have severe limitations. There’s work ongoing to add
cross-release dependency tracking to
lockdep, but nothing looks anywhere near
ready to merge. Since these dependency chains can be really long and get ever
longer when more code is added to a worker - dependencies are pulled in even
if only a single lock is held at any given time - this can quickly become a
nightmare to untangle.
Often the requirement to hold a lock over these barrier type functions comes from the fact that the object would disappear. Or otherwise undergo some serious confusion about it’s lifetime state - not just whether it’s still alive or getting destroyed, but also who exactly owns it or whether it’s maybe a resurrected zombie representing a different instance now. This encourages that the lock morphs from a “protects some specific data” to a “protects specific code from running” design, leading to all the code maintenance issues discussed in the protect data, not code principle.
For these reasons try as hard as possible to not hold any locks, or as few as feasible, when calling any of these memory barriers in disguise functions used to manage object lifetime or ownership in general. The antipattern here is abusing locks to fix lifetime issues. We have seen two specific instances thus far:
kref_put_mutex instead of kref_get_unless_zero() in
the weak reference pattern. This is a
special case of the reference counting
pattern, but with some finer-grained
locking added to support weak references.
Calling flush_work() while holding locks in the async
worker. This is a special case of the
single owner pattern, again with a bit more
locking added to support some mutable state.
We will see some more, but the antipattern holds in general as a source of troubles.
We’ve looked at a pile of functional reasons for complicating the locking design, but sometimes you need to add more fine-grained locking for performance reasons. This is already getting dangerous, because it’s very tempting to tune some microbenchmark just because we can, or maybe delude ourselves that it will be needed in the future. Therefore only complicate your locking if:
You have actual real world benchmarks with workloads relevant to users that show measurable gains outside of statistical noise.
You’ve fully exhausted architectural changes to outright avoid the overhead, like io_uring pre-registering file descriptors locally to avoid manipulating the file descriptor table.
You’ve fully exhausted algorithm improvements like batching up operations to amortize locking overhead better.
Only then make your future maintenance pain guaranteed worse by applying more tricky locking than the bare minimum necessary for correctness. Still, go with the simplest approach, often converting a lock to its read-write variant is good enough.
Sometimes this isn’t enough, and you actually have to split up a lock into more fine-grained locks to achieve more parallelism and less contention among threads. Note that doing so blindly will backfire because locks are not free. When common operations still have to take most of the locks anyway, even if it’s only for short time and in strict succession, the performance hit on single threaded workloads will not justify any benefit in more threaded use-cases.
Another issue with more fine-grained locking is that often you cannot define a strict nesting hierarchy, or worse might need to take multiple locks of the same object or lock class. I’ve written previously about this specific issue, and more importantly, how to teach lockdep about lock nesting, the bad and the good ways.
One really entertaining story from the GPU subsystem, for bystanders at least, is that we really screwed this up for good by defacto allowing userspace to control the lock order of all the objects involved in an IOCTL. Furthermore disjoint operations should actually proceed without contention. If you ever manage to repeat this feat you can take a look at the wait-wound mutexes. Or if you just want some pretty graphs, LWN has an old article about wait-wound mutexes too.
Do not go here wanderer!
Seriously, I have seen a lot of very fancy driver subsystem locking designs, I have not yet found a lot that were actually justified. Because only real world, non-contrived performance issues can ever justify reaching for this level, and in almost all cases algorithmic or architectural fixes yield much better improvements than any kind of (locking) micro-optimization could ever hope for.
Hence this is just a long list of antipatterns, so that people who have not yet a grumpy expression permanently chiseled into their facial structure know when they’re in trouble.
Note that this section isn’t limited to lockless tricks in the academic sense of
guaranteed constant overhead forward progress, meaning no spinning or retrying
anywhere at all. It’s for everything which doesn’t use standard locks like
struct mutex, spinlock_t, struct
rw_semaphore, or any of the others provided in the Linux kernel.
Yeah RCU is really awesome and impressive, but it comes at serious costs:
By design, at least with standard usage, RCU elevates mixing up lifetime and
consistency
concerns
to a virtue. rcu_read_lock() gives you both a read-side critical
section and it extends the lifetime of any RCU protected object. There’s
absolutely no way you can avoid that antipattern, it’s built in.
Worse, RCU read-side critical section nest rather freely, which means unlike with real locks abusing them to keep objects alive won’t run into nasty locking inversion issues when you pull that stunt with nesting different objects or classes of objects. Using locks to paper over lifetime issues is bad, but with RCU it’s weapons-grade levels of dangerous.
Equally nasty, RCU practically forces you to deal with zombie objects, which breaks the reference counting pattern in annoying ways.
On top of all this breaking out of RCU is costly and kinda defeats the point,
and hence there’s a huge temptation to delay this as long as possible. Meaning
check as many things and dereference as many pointers under RCU protection as
you can, before you take a real lock or upgrade to a proper reference with
kref_get_unless_zero().
Unless extreme restraint is applied this results in RCU leading you towards locking antipatterns. Worse RCU tends to spread them to ever more objects and ever more fields within them.
All together all freely using RCU achieves is proving that there really is no
bottom on the code maintainability scale. It is not a great day when your driver
dies in synchronize_rcu() and lockdep has no idea what’s going on,
and I’ve seen such days.
Personally I think in driver subsystem the most that’s still a legit and
justified use of RCU is for object lookup with struct xarray and
kref_get_unless_zero(), and cleanup handled entirely by
kfree_rcu(). Anything more and you’re very likely chasing a rabbit
down it’s hole and have not realized it yet.
Firstly, Linux atomics have two annoying properties just to start:
Unlike e.g. C++ atomics in userspace they are unordered or weakly ordered by default in a lot of cases. A lot of people are surprised by that, and then have an even harder time understanding the memory barriers they need to sprinkle over the code to make it work correctly.
Worse, many atomic functions neither operate on the atomic types
atomic_t and atomic64_t nor have atomic
anywhere in their names, and so pose serious pitfalls to reviewers:
READ_ONCE() and WRITE_ONCE for volatile stores and
loads.cmpxchg() and the various variants of atomic exchange with or
without a compare operation.set_bit() are all atomic. Worse, their
non-atomic variants have the __set_bit() double underscores to
scare you away from using them, despite that these are the ones you really
want by default.Those are a lot of unnecessary trap doors, but the real bad part is what people tend to build with atomic instructions:
I’ve seen at least three different, incomplete and ill-defined reimplementations of read write semaphores without lockdep support. Reinventing completions is also pretty popular. Worse, the folks involved didn’t realize what they built. That’s an impressive violation of the “Make it Correct” principle.
It seems very tempting to build terrible variations of the “no locking” patterns. It’s very easy to screw them up by extending them in a bad way, e.g. reference counting with weak reference or RCU optimizations done wrong very quickly leads to a complete mess. There are reasons why you should never deviate from these.
What looks innocent are statistical counters with atomics, but almost always
there’s already a lock you could take instead of unordered counter updates.
Often resulting in better code organization to boot since the statistics for a
list and it’s manipulation are then closer together. There are some exceptions
with real performance justification, a recent one I’ve seen is memory
shrinkers where you really want your shrinker->count_objects() to
not have to acquire any locks. Otherwise in a memory intense workload all
threads are stuck on the one thread doing actual reclaim holding the same lock
in your shrinker->scan_objects() function.
In short, unless you’re actually building a new locking or synchronization primitive in the core kernel, you most likely do not want to get seen even looking at atomic operations as an option.
preempt/local_irq/bh_disable() and Friends …This one is simple: Lockdep doesn’t understand them. The real-time folks hate
them. Whatever it is you’re doing, use proper primitives instead, and at least
read up on the LWN coverage on why these are
problematic what to do instead. If you need
some kind of synchronization primitive - maybe to avoid the lifetime vs.
consistency antipattern
pitfalls -
then use the proper functions for that like synchronize_irq().
Or more often, lack of them, incorrect or imbalanced use of barriers, badly or wrongly or just not at all documented memory barriers, or …
Fact is that exceedingly most kernel hackers, and more so driver people, have no useful understanding of the Linux kernel’s memory model, and should never be caught entertaining use of explicit memory barriers in production code. Personally I’m pretty good at spotting holes, but I’ve had to learn the hard way that I’m not even close to being able to positively prove correctness. And for better or worse, nothing short of that tends to cut it.
For a still fairly cursory discussion read the LWN series on lockless algorithms. If the code comments and commit message are anything less rigorous than that it’s fairly safe to assume there’s an issue.
Now don’t get me wrong, I love to read an article or watch a talk by Paul McKenney on RCU like anyone else to get my brain fried properly. But aside from extreme exceptions this kind of maintenance cost has simply no justification in a driver subsystem. At least unless it’s packaged in a driver hacker proof library or core kernel service of some sorts with all the memory barriers well hidden away where ordinary fools like me can’t touch them.
I hope you enjoyed this little tour of progressively more worrying levels of locking engineering, with really just one key take away:
Simple, dumb locking is good locking, since with that you have a fighting chance to make it correct locking.
Thanks to Daniel Stone and Jason Ekstrand for reading and commenting on drafts of this text.
For various reasons I spent the last two years way too much looking at code with terrible locking design and trying to rectify it, instead of a lot more actual building cool things. Symptomatic that the last post here on my neglected blog is also a rant on lockdep abuse.
I tried to distill all the lessons learned into some training slides, and this two part is the writeup of the same. There are some GPU specific rules, but I think the key points should apply to at least apply to kernel drivers in general.
The first part here lays out some principles, the second part builds a locking engineering design pattern hierarchy from the most easiest to understand and maintain to the most nightmare inducing approaches.
Also with locking engineering I mean the general problem of protecting data structures against concurrent access by multiple threads and trying to ensure that each sufficiently consistent view of the data it reads and that the updates it commits won’t result in confusion. Of course it highly depends upon the precise requirements what exactly sufficiently consistent means, but figuring out these kind of questions is out of scope for this little series here.
Designing a correct locking scheme is hard, validating that your code actually implements your design is harder, and then debugging when - not if! - you screwed up is even worse. Therefore the absolute most important rule in locking engineering, at least if you want to have any chance at winning this game, is to make the design as simple and dumb as possible.
Since this is the key principle the entire second part of this series will go through a lot of different locking design patterns, from the simplest and dumbest and easiest to understand, to the most hair-raising horrors of complexity and trickiness.
Meanwhile let’s continue to look at everything else that matters.
Since simple doesn’t necessarily mean correct, especially when transferring a concept from design to code, we need guidelines. On the design front the most important one is to design for lockdep, and not fight it, for which I already wrote a full length rant. Here I will only go through the main lessons: Validating locking by hand against all the other locking designs and nesting rules the kernel has overall is nigh impossible, extremely slow, something only few people can do with any chance of success and hence in almost all cases a complete waste of time. We need tools to automate this, and in the Linux kernel this is lockdep.
Therefore if lockdep doesn’t understand your locking design your design is at fault, not lockdep. Adjust accordingly.
A corollary is that you actually need to teach lockdep your locking rules, because otherwise different drivers or subsystems will end up with defacto incompatible nesting and dependencies. Which, as long as you never exercise them on the same kernel boot-up, much less same machine, wont make lockdep grumpy. But it will make maintainers very much question why they are doing what they’re doing.
Hence at driver/subsystem/whatever load time, when CONFIG_LOCKDEP is enabled, take all key locks in the correct order. One example for this relevant to GPU drivers is in the dma-buf subsystem.
In the same spirit, at every entry point to your library or subsytem, or
anything else big, validate that the callers hold up the locking contract with
might_lock(), might_sleep(), might_alloc() and all the variants and
more specific implementations of this. Note that there’s a huge overlap between
locking contracts and calling context in general (like interrupt safety, or
whether memory allocation is allowed to call into direct reclaim), and since all
these functions compile away to nothing when debugging is disabled there’s
really no cost in sprinkling them around very liberally.
On the implementation and coding side there’s a few rules of thumb to follow:
Never invent your own locking primitives, you’ll get them wrong, or at least build something that’s slow. The kernel’s locks are built and tuned by people who’ve done nothing else their entire career, you wont beat them except in bug count, and that by a lot.
The same holds for synchronization primitives - don’t build your own with a
struct wait_queue_head, or worse, hand-roll your own wait queue.
Instead use the most specific existing function that provides the
synchronization you need, e.g. flush_work() or
flush_workqueue() and the enormous pile of variants available for
synchronizing against scheduled work items.
A key reason here is that very often these more specific functions already come with elaborate lockdep annotations, whereas anything hand-roll tends to require much more manual design validation.
Finally at the intersection of “make it dumb” and “make it correct”, pick the simplest lock that works, like a normal mutex instead of an read-write semaphore. This is because in general, stricter rules catch bugs and design issues quicker, hence picking a very fancy “anything goes” locking primitives is a bad choice.
As another example pick spinlocks over mutexes because spinlocks are a lot more strict in what code they allow in their critical section. Hence much less risk you put something silly in there by accident and close a dependency loop that could lead to a deadlock.
Speed doesn’t matter if you don’t understand the design anymore in the future, you need simplicity first.
Speed doesn’t matter if all you’re doing is crashing faster. You need correctness before speed.
Finally speed doesn’t matter where users don’t notice it. If you micro-optimize a path that doesn’t even show up in real world workloads users care about, all you’ve done is wasted time and committed to future maintenance pain for no gain at all.
Similarly optimizing code paths which should never be run when you instead improve your design are not worth it. This holds especially for GPU drivers, where the real application interfaces are OpenGL, Vulkan or similar, and there’s an entire driver in the userspace side - the right fix for performance issues is very often to radically update the contract and sharing of responsibilities between the userspace and kernel driver parts.
The big example here is GPU address patch list processing at command submission time, which was necessary for old hardware that completely lacked any useful concept of a per process virtual address space. But that has changed, which means virtual addresses can stay constant, while the kernel can still freely manage the physical memory by manipulating pagetables, like on the CPU. Unfortunately one driver in the DRM subsystem instead spent an easy engineer decade of effort to tune relocations, write lots of testcases for the resulting corner cases in the multi-level fastpath fallbacks, and even more time handling the impressive amounts of fallout in the form of bugs and future headaches due to the resulting unmaintainable code complexity …
In other subsystems where the kernel ABI is the actual application contract these kind of design simplifications might instead need to be handled between the subsystem’s code and driver implementations. This is what we’ve done when moving from the old kernel modesetting infrastructure to atomic modesetting. But sometimes no clever tricks at all help and you only get true speed with a radically revamped uAPI - io_uring is a great example here.
A common pitfall is to design locking by looking at the code, perhaps just sprinkling locking calls over it until it feels like it’s good enough. The right approach is to design locking for the data structures, which means specifying for each structure or member field how it is protected against concurrent changes, and how the necessary amount of consistency is maintained across the entire data structure with rules that stay invariant, irrespective of how code operates on the data. Then roll it out consistently to all the functions, because the code-first approach tends to have a lot of issues:
A code centric approach to locking often leads to locking rules changing over the lifetime of an object, e.g. with different rules for a structure or member field depending upon whether an object is in active use, maybe just cached or undergoing reclaim. This is hard to teach to lockdep, especially when the nesting rules change for different states. Lockdep assumes that the locking rules are completely invariant over the lifetime of the entire kernel, not just over the lifetime of an individual object or structure even.
Starting from the data structures on the other hand encourages that locking rules stay the same for a structure or member field.
Locking design that changes depending upon the code that can touch the data would need either complicated documentation entirely separate from the code - so high risk of becoming stale. Or the explanations, if there are any are sprinkled over the various functions, which means reviewers need to reacquire the entire relevant chunks of the code base again to make sure they don’t miss an odd corner cases.
With data structure driven locking design there’s a perfect, because unique place to document the rules - in the kerneldoc of each structure or member field.
A consequence for code review is that to recheck the locking design for a code first approach every function and flow has to be checked against all others, and changes need to be checked against all the existing code. If this is not done you might miss a corner cases where the locking falls apart with a race condition or could deadlock.
With a data first approach to locking changes can be reviewed incrementally against the invariant rules, which means review of especially big or complex subsystems actually scales.
When facing a locking bug it’s tempting to try and fix it just in the affected code. By repeating that often enough a locking scheme that protects data acquires code specific special cases. Therefore locking issues always need to be first mapped back to new or changed requirements on the data structures and how they are protected.
The big antipattern of how you end up with code centric locking is to protect
an entire subsystem (or worse, a group of related subsystems) with a single
huge lock. The canonical example was the big kernel lock BKL, that’s gone, but
in many cases it’s just replaced by smaller, but still huge locks like
console_lock().
This results in a lot of long term problems when trying to adjust the locking design later on:
Since the big lock protects everything, it’s often very hard to tell what it does not protect. Locking at the fringes tends to be inconsistent, and due to that its coverage tends to creep ever further when people try to fix bugs where a given structure is not consistently protected by the same lock.
Also often subsystems have different entry points, e.g. consoles can be reached through the console subsystem directly, through vt, tty subsystems and also through an enormous pile of driver specific interfaces with the fbcon IOCTLs as an example. Attempting to split the big lock into smaller per-structure locks pretty much guarantees that different entry points have to take the per-object locks in opposite order, which often can only be resolved through a large-scale rewrite of all impacted subsystems.
Worse, as long as the big subsystem lock continues to be in use no one is spotting these design issues in the code flow. Hence they will slowly get worse instead of the code moving towards a better structure.
For these reasons big subsystem locks tend to live way past their justified usefulness until code maintenance becomes nigh impossible: Because no individual bugfix is worth the task to really rectify the design, but each bugfix tends to make the situation worse.
Stay tuned for next week’s installment, which will cover what these principles mean when applying to practice: Going through a large pile of locking design patterns from the most desirable to the most hair raising complex.
There is a steady progress being made since :tada: Turnip is Vulkan 1.1 Conformant :tada:. We now support GL 4.6 via Zink, implemented a lot of extensions, and are close to Vulkan 1.3 conformance.
Support of real-world games is also looking good, here is a video of Adreno 660 rendering “The Witcher 3”, “The Talos Principle”, and “OMD2”:
All of them have reasonable frame rate. However, there was a bit of “cheating” involved. Only “The Talos Principle” game was fully running on the development board (via box64), other two games were only rendered in real time on Adreno GPU, but were ran on x86-64 laptop with their VK commands being streamed to the dev board. You could read about this method in my post “Testing Vulkan drivers with games that cannot run on the target device”.
The video was captured directly on the device via OBS with obs-vkcapture, which worked surprisingly well after fighting a bunch of issues due to the lack of binary package for it and a bit dated Ubuntu installation.
A number of extensions were implemented that are required for Zink to support higher GL versions. As of now Turnip supports OpenGL 4.6 via Zink, and while yet not conformant - only a handful of GL CTS tests are failing. For the perspective, Freedreno (our GL driver for Adreno) supports only OpenGL 3.3.
For Zink adventures and profound post titles check out Mike Blumenkrantz’s awesome blog supergoodcode.com
If you are interested in Zink over Turnip bring up in particular, you should read:
A major improvement for low resolution Z optimization (LRZ) was recently made in Turnip, read about it in the previous post of mine: LRZ on Adreno GPUs
Anyway, since the last update Turnip supports many more extensions (in no particular order):
 From mesamatrix.net/#Vulkan1.3
For Vulkan 1.3 conformance there are only a few extension left to implement. The only major ones are VK_KHR_dynamic_rendering and VK_EXT_inline_uniform_block required for Vulkan 1.3. VK_KHR_dynamic_rendering is currently being reviewed and foundation for VK_EXT_inline_uniform_block was recently merged.
That’s all for today!
Unless you’ve run into a terrible problem with your GPU, I bet you never spent some time actually thinking about how we depend so heavily on graphics to actually do anything meaningful1 on a computer: from small square blinking letters on a terminal to the utmost insanely complex games we play these days - in the context of Linux, it all depends on the DRI!
This should come as surprise to no one! And as you can probably imagine, the Linux graphics stack is comprised of many layers of abstractions, going from the largely abstracted userspace application that you’re running (a browser!) to the bytecode that is actually interpreted by your graphics card.
These many abstractions are what allow us to have our glorious moments of being a hero (or maybe a villain, whatever you’re up to…) without even noticing what’s happening, and – most importantly – that allow game devs to make such complex games without having to worry about an awful lot of details. They’re really a marvel of engineering (!), but not by accident!
All of those abstraction layers come with a history of their own2, and it’s kinda amazing that we can even have such a smooth experience with all of those, community-powered, beautifully thought out, moving pieces, twisting and turning in a life of their own.
Just have a look at the beast we’ll be getting into! Feeling adventurous today, ain’t you? Well, fear not. It’s definitely not as bad as it seems, and there’s a lot of logic behind (most) things, so let’s go step by step :).
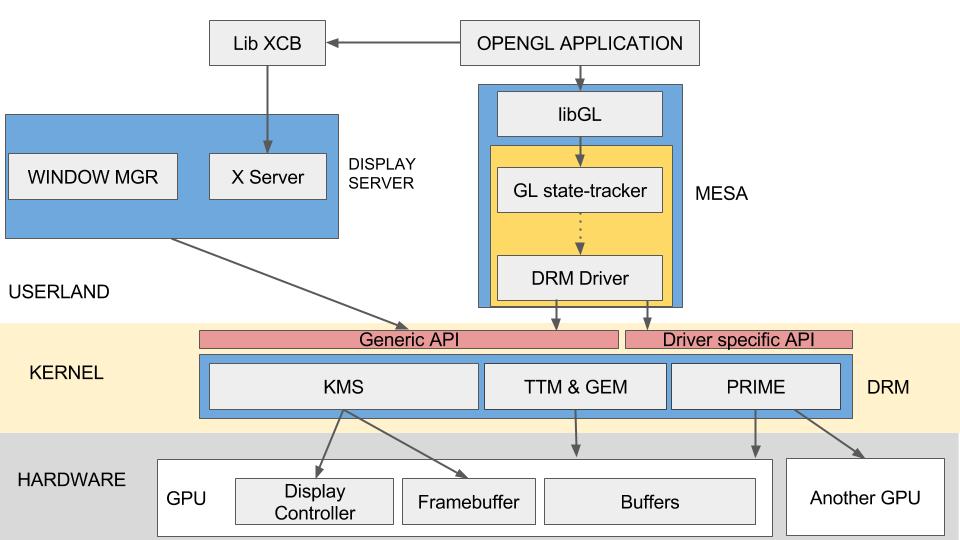
Though in most cases we start from the bottom of the stack and build our way towards the top, here I think it makes more sense for us to build it upside down, as that’s what we’re used to interacting with.
On a funny thought experiment, maybe driver designers do live upside down, who knows…
Even though Linux is generally regarded as a developer/hacker OS, most modern distributions don’t require you to ever leave a graphic environment. Even if you love using the “terminal” on your distro, that’s simply a terminal emulator, which “simulates” using a modern TTY3.
While TTYs are provided by the kernel itself, we need so-called display servers to actually render something more complex to the user’s screen. It acts as an intermediate, dealing with multiple applications wanting to draw things to the screen simultaneously.
As Linux was created during an era where computation was very much migrating from a model of “distributed access” (through time-sharing1), you can still peek into a TTY if you want to:
On most distribution, pressing
CTRL+ALT+F1(or+F2,+F3and so on) will take you to an old-school text-only display (of course one of these TTYs will also contain the display server session you began with).


Check out a classic teleprinter in action in this video or, if you want to understand the working details on Linux, check out the TTY demystified blog post.
But then, it seems logical that the graphic session we’re used to is one layer above the OS itself, which only provides those TTYs and, quite likely, the Application Binary Interface (i.e. ABI) needed to “talk” to the OS, which is indeed the case (currently) :).
In an X session for example, the X server (or your compositor) will render its windows through this ABI, and not directly through the hardware. Actually, the kernel ABI for hardware access through the Direct Rendering Infrastructure (DRI) is a recent development. Before it, the X server would simply access hardware directly, so all userspace software depended on it, and the slightest lack of coordination between applications could wreak havoc in the graphics card 😵!


The X server has many years of history and lots of “curious” design choices (to put it lightly). If you’re at all interested on understand it better, have a look at the xplain blog!
But enough historic techno-babble! How does our application, then, render its stuff using a window server? The short answer is: it doesn’t!
Actually, anything that wants to render elements that are independent of a window server will have to use a graphics API like OpenGL, and that’s where Mesa comes in!
First, notice that we’re already down a level: the window server shows us cute windows and deals with user input in that interface, wonderful! But then I open Minecraft, and we’re already asking for 3D objects which the window server can’t possibly handle effectively, so Mesa was introduced to provide a second route for applications to send their complex commands directly to the kernel, without the need to go through the display sessions’ (bloated and slow) rendering mechanisms, which are quite often single-handedly optimized to show us application interfaces (the infamous GUIs).
As a side note, the X server is also OpenGL capable, and you can see this
through its glx* API commands, or even some commands (ever heard of
glxgears? 😏).
On a birds eye view, our (supposed) game will try to run its 3D routines, which
are written in shader-speak (for example OpenGL’s, whose language is called
GLSL), which Mesa handles for us, compiling and optimizing it for our
specific GPU, then sending it to be run by the kernel, just like your window
server does, but for anything!
An important point to notice here is that, of course, the window server is still needed for user interaction in our game. It will query and send user commands to the application, and will also handle windowing and displaying stuff (including our game, as its window is still managed by the window server), as well as dealing with many other system-related interactions that would be a nightmare for game devs to implement.
Another important point is that writing user applications which don’t require using shaders would be a total nightmare without a display manager, as it provides many useful abstractions for that use case (which already covers >90% of the uses cases for most people).
We’re getting close! Next stop is: the Linux kernel!
The Linux kernel is, of course, comprised of many moving parts, including inside the Direct Rendering Manager (DRM) itself, which I cannot possibly explain in this one blog post (sorry about that!).
The DRM is addressed using ioctls (short for I/O Control), which are
syscalls (short for System Call) used for device specific control, as
providing generalist syscalls would be nearly impossible – it’s more
feasible to create one ioctl(device, function, parameters) then treat this in
a driver than to create 2000 mygpu_do_something_syscall(parameters) for
“obvious” reasons.
For the inexperienced reader, it’s interesting to notice here that the approach
of one syscall per driver-specific command would bloat the general kernel ABI
with too many generally useless functions, as the large majority of them would
be used for one and only one driver.
Just for reference, in my kernel I have 465 syscalls as defined in the
system manual. Putting this vs a simple estimate of drivers in the kernel *
commands only they use should give you some perspective on the issue.
Just use
man syscalls | grep -E '.*\(2.\s+[0-9.]+' | wc -lif you want to query thesyscalls defined in your kernel.
Those ioctls are then wrapped inside a
libdrm library that provides a
more comprehensible interface for the poor Mesa developers, which would
otherwise need to keep checking every ioctl they want to use for the
unusual macro names
provided by the kernel’s userspace API.
One very shady aspect of graphics rendering that the DRM deals with is GPU memory management, and it does this through two interfaces, namely:
The older of those two is TTM, which was a generalist approach for memory management, and it provides literally everything anyone could ever hope for. That being said, TTM is regarded as too difficult to use45 as it provides a gigantic API, and very convoluted must-have features that end up being unyielding. For instance, TTM’s fencing mechanism – which is responsible for coordinating memory access between the GPU and CPU, just like semaphores if you’re used to them at all – has a very odd interface. We could also talk about TTM’s general inefficiencies which have been noted time and time again, as well as its “wicked ways” of doing things, which abuse the DMA (short for Direct Memory Access) API for one (check out König’s talk for more6).
Just like evolution, an alternative to TTM had to come along, and that was our friend GEM – which was conceived by Intel, as a simplified interface for memory management. It’s much easier to use by comparison, but also much more simplified and thus, only fully attends Intel’s specific use case – that is, integrated video cards7 –, as it’s limited to addressing memory shared by both GPU and CPU (no discrete video card support at all, really). It also won’t handle any fencing, and simply “wait” for the GPU to finish its thing before moving on, which is a no-no for those beefy discrete GPUs.
Then, as anyone sane would much rather be dealing with GEM, all software
engineers fired themselves from other companies and went to Intel. I hear
they’re currently working hard to deprecate TTM in an integrated graphics
supremacy movement. Jokes aside, what actually happened is that DRM drivers
will usually implement the needed memory management (including fencing)
functionality in TTM, but provide GEM-like APIs for those things, so that
everyone ends up happy (except for the people implementing these interfaces, as
they’re probably quite depressed).
These memory related aspects are a rabbit hole of their own, and if you’d like to have a deeper look into this, I recommend these resources:
It’s important to notice, though, that kernel devs are working hard into making TTM nicer all around, as it’s used by too many drivers to simply, paraphrasing König, “be set on fire” and start a memory interface anew. If you want some perspective, take a look at Christian König’s amazing talk1, where he talks about TTM from the viewpoint of a maintainer.
Notice, however, that the DRM is only responsible for graphics rendering and display mode-setting (that is, basically, setting resolution and refresh rate) is done in a separate (but related) subsystem, called KMS (short for Kernel Mode Setting).
The KMS logically separates various aspects of image transmission, such as
And you can actually find where this information is available by consulting the
/sys/class/drm folder. There you can see subdirectories referring to specific
graphics cards (i.e. card*) and also their render nodes, which indicate
their capabilities of executing general programming applications, like the
ones in machine learning, which don’t depend on having a graphical output.
Inside these subdirectories, then, you can see some files indicating things
like connection status or mode list.
For a quick overview, check out this image:

I can already hear you say
OMG Isinya, that was a hell of a lot of information 😵.
But hey, you just read it through (what a nerd)! On a following post I’ll talk about testing the kernel pieces of this puzzle, hope to see you then :).
A small disclaimer: of course there are many disabled people which need other methods of interaction with a computer that don’t rely as heavily on graphics, and I do think it’s a huge problem that we don’t have alternatives for those people in a large majority of cases, as most software does not give the lightest thought to the vision impaired. I should talk more about this in the future but, for now, please don’t forget it’s an existing issue that needs addressing!
Which I might even talk about in another post – excuse me, but that requires a little too much research for the time I have currently.
A classical TTY (or teleprinter for the acquainted) used to be an endpoint for interaction with a central computer that held all the resources for users (we call that a time-sharing computer), and was actually not much used outside of that context. A terminal emulator would be called a pseudo TTY (PTY).
The attentive reader might have thought about Intel’s discrete video cards at this point, and as a matter of fact Intel is actually working with TTM to support those products. See: phoronix.com - Linux 5.14 enabling Intel graphics TTM usage for their dGPUs
$ vlan
Device not provided

    vlan $DEV $VLAN $SUBNET

    vlan eth0 42 10.31.155.1/27
This is a achieved by pasting the below function into your .bashrc / .zshrc and issuing a source .bashrc or source .zshrc correspondingly.
function vlan {
    DEV=$1
    VLAN=$2
    ADDR=$3

    HELP="

    vlan \$DEV \$VLAN \$SUBNET

    vlan eth0 42 10.31.155.1/27
"

    if [ -z "$DEV" ]; then
        echo "Device not provided"
        echo "$HELP"
        return 1
    fi

    ip link | grep "${DEV}: " >/dev/null 2>&1
    if [ $? -ne 0 ]; then
        echo "\"$DEV\" is not a valid device"
        echo "$HELP"
        return 1
    fi

    if [ -z "$VLAN" ]; then
        echo "VLAN not provided"
        echo "$HELP"
        exit 1
    fi
    REGEX='^[0-9]+$'
    if ! [[ $VLAN =~ $REGEX ]] ; then
        echo "\"$VLAN\" is not a number" >&2; exit 1
echo …The software Vulkan renderer in Mesa, lavapipe, achieved official Vulkan 1.3 conformance. The official entry in the table is here . We can now remove the nonconformant warning from the driver. Thanks to everyone involved!
Anyone else remember way back years ago when I implemented descriptor caching for zink because I couldn’t even hit 60 fps in Unigine Heaven due to extreme CPU bottlenecking? Also because I got to make incredible flowcharts to post here?
Good times.
Simpler times.
But now times have changed.
As recently as a year ago I blogged about new descriptor infrastructure I was working on, specifically “lazy” descriptors. This endeavor was the culmination of a month or two of wild exploration into the problem space, trying out a number of less successful options.
But it turns out the most performant option was always going to be the stupidest one: create new descriptors on every draw and jam them into the GPU.
But why is this the case?
The answer lies in an extension that has become much more widely adopted, VK_KHR_descriptor_update_template. This extension allows applications to allocate a template that the driver can use to jam those buffers/images into descriptor sets much more efficiently than the standard vkUpdateDescriptorSets. When combined with extreme bucket allocating, this methodology ends up being more performant than caching.
And sometimes by significant margins.
In Minecraft, for example, you might see a 30-50% FPS increase. In a game like Tomb Raider (2013) it’ll be closer to 10-20%.
But, most likely, there won’t be any scenario in which FPS goes down.
So wave farewell to the old code that I’ll probably delete altogether in Mesa 22.3, and embrace the new code that just works better and has been undergoing heavy testing for the past year.
Welcome to the future.
Last week, the series with DRM Kernel Selftests conversion to KUnit tests was merged into drm-misc-next and will probably be on the mainline on 5.20.
This series was developed during an LKCAMP hackathon in October 2021 and is the combined effort of seven Linux Kernel beginners. In this hackathon, we learned about the KUnit Framework and also learned a bit about DRM.
The series took quite a while to come out, as it was just a side-project to most of us, but, in June, I finally prepared the patches and transformed them into a mergeable series.
So, let’s understand the differences between kselftests and KUnit tests and learn some about the KUnit framework.
Tests are not all the same. We create different kinds of tests for different purposes. So, let’s clarify some kinds of tests that will be quoted in this blogpost:
Linux Kernel Selftests (kselftest) is a set of features functional and regression tests developed to avoid regressions on the Linux Kernel. The idea is that the developer will find a regression, fix it, and then write a test so that the Kernel won’t have this regression again.
The kselftests use shell scripts and C programs to load the tests into the kernel and have support for hardware-dependent tests. It doesn’t support workload or application tests, as its idea is primarily to increase the breadth and depth test coverage on the Kernel.
Although not designed for it, unit tests can also be developed with kselftests. But noticed that it is not a Unit Test Framework, such as JUnit, Google Test, or PyTest.
kselftest has C interfaces for reporting test results using the Test Anything Protocol (TAP) and a test harness for running tests.
KUnit (Kernel Unit Testing Framework) is the Unit Testing Framework for the Linux Kernel. KUnit makes it possible to run test suites on kernel boot or load the tests as a module. It reports all test case results through a TAP (Test Anything Protocol) in the kernel log.
KUnit follows the white-box testing approach, which allows testers to inspect and verify the inner workings of a software system. So, it can test any kernel component and is not restricted to userspace.
KUnit doesn’t require installing the kernel on a test machine or in a VM. It addresses the problem of being able to run tests without needing a virtual machine or actual hardware with User Mode Linux.
KUnit provides facilities for defining unit test cases, grouping related test cases into test suites, providing common infrastructure for running tests, and much more.
Each one of the frameworks has its place and importance, as both kinds of tests are important to improve Kernel’s reliability and robustness.
The main difference between kselftest and KUnit is that KUnit is a unit testing framework and kselftest is not. kselftest requires installing the kernel on a test machine or in a VM and require tests to be written in userspace and run on the kernel under test. On the other side, KUnit does not.
So, when it comes to testing a single unit of code in isolation, you’ll definitely go with KUnit. Otherwise, you’ll have to check the kselftests or autotests frameworks.
First, I must point out that the DRM selftests are not kselftests. They work very similarly, but the DRM subsystem developed a unique structure for running their unit tests, which was available on drm_selftests.h. For a general idea, they had simple FAIL_ON(expression) assertions, indicating that the test would fail if the expression was true, and each test was a module initialized by run_selftests.
So, let’s check a DRM selftest function and analyze it to check if it’s plausible for conversion. Take this function from drivers/gpu/drm/selftests/drm_cmdline_selftests.h:
static int drm_cmdline_test_force_D_only_not_digital(void *ignored)
{
	struct drm_cmdline_mode mode = { };

	FAIL_ON(!drm_mode_parse_command_line_for_connector("D",
							   &no_connector,
							   &mode));
	FAIL_ON(mode.specified);
	FAIL_ON(mode.refresh_specified);
	FAIL_ON(mode.bpp_specified);

	FAIL_ON(mode.rb);
	FAIL_ON(mode.cvt);
	FAIL_ON(mode.interlace);
	FAIL_ON(mode.margins);
	FAIL_ON(mode.force != DRM_FORCE_ON);

	return 0;
}
This test function is testing a single function drm_mode_parse_command_line_for_connector and using test assertion to check if it behaves as expected. Can we agree that this is testing a single unit of code in isolation? So, this is a unit test!
If you look through the other files, you are going to find out that they are very similar to this function. So, they are all unit tests.
As they are unit tests, it is more suitable to use a Unit Test Framework, such as KUnit, on these tests. Moreover, converting these tests to KUnit would make them smaller and provide a userspace tool for developers to test with.
There is also one more reason to convert the DRM selftests. As DRM selftests created a whole structure to run their unit tests, converting the tests would mean deleting this structure and promoting code reuse.
KUnit has multiple test expectation expressions. The most used ones are:
KUNIT_EXPECT_TRUE (test, condition): causes a test failure when the expression is not true.KUNIT_EXPECT_FALSE (test, condition): causes a test failure when the expression is not false.KUNIT_EXPECT_EQ (test, left, right): expects that left and right are equal.KUNIT_EXPECT_NE (test, left, right): expects that left and right are not equal.There are a couple more and all of them can be seen on the KUnit documentation.
Examining again the drm_mode_parse_command_line_for_connector function, we can see that the test expectation expression used is FAIL_ON. This means that the test will fail when the expression inside it is true. Checking the test expectation expressions listed above, we can say the equivalent of FAIL_ON is KUNIT_EXPECT_FALSE, right?
So, we can just adjust the function to the KUnit signature and change all FAIL_ON for KUNIT_EXPECT_FALSE. The result will be something like this:
static void drm_cmdline_test_force_D_only_not_digital(struct kunit *test)
{
	struct drm_cmdline_mode mode = { };

	KUNIT_EXPECT_FALSE(test, !drm_mode_parse_command_line_for_connector("D",
							   &no_connector,
							   &mode));
	KUNIT_EXPECT_FALSE(test, mode.specified);
	KUNIT_EXPECT_FALSE(test, mode.refresh_specified);
	KUNIT_EXPECT_FALSE(test, mode.bpp_specified);

	KUNIT_EXPECT_FALSE(test, mode.rb);
	KUNIT_EXPECT_FALSE(test, mode.cvt);
	KUNIT_EXPECT_FALSE(test, mode.interlace);
	KUNIT_EXPECT_FALSE(test, mode.margins);
	KUNIT_EXPECT_FALSE(test, mode.force != DRM_FORCE_ON);
}
After this, our test already works with the KUnit tool. But, there is still some improvement to be made. Check out the first assertion:
KUNIT_EXPECT_FALSE(test, !drm_mode_parse_command_line_for_connector("D",
							   &no_connector,
							   &mode));
Observe that the condition has a logical NOT operator, so, for the condition to be false, the function must return true. So, we can change the assertion to be more readable to:
KUNIT_EXPECT_TRUE(test, drm_mode_parse_command_line_for_connector("D",
							   &no_connector,
							   &mode));
The last assertion can also be changed. We can change the comparative logical operator for the KUNIT_EXPECT_EQ expression.
So, the final look of our unit test would be:
static void drm_cmdline_test_force_D_only_not_digital(struct kunit *test)
{
	struct drm_cmdline_mode mode = { };

	KUNIT_EXPECT_TRUE(test, drm_mode_parse_command_line_for_connector("D",
							   &no_connector,
							   &mode));
	KUNIT_EXPECT_FALSE(test, mode.specified);
	KUNIT_EXPECT_FALSE(test, mode.refresh_specified);
	KUNIT_EXPECT_FALSE(test, mode.bpp_specified);

	KUNIT_EXPECT_FALSE(test, mode.rb);
	KUNIT_EXPECT_FALSE(test, mode.cvt);
	KUNIT_EXPECT_FALSE(test, mode.interlace);
	KUNIT_EXPECT_FALSE(test, mode.margins);
	KUNIT_EXPECT_EQ(test, mode.force, DRM_FORCE_ON);
}
This is just a small bit of the work done! I and other LKCAMP participants converted tests across nine files. And the result can be seen on this mailing list thread.
Working on these tests over the last month was pretty satisfying. The series had five iterations over the mailing list and talking to the maintainers is very rewarding. Also, it was great to remember the Saturday that I spend with three very dear friends (thanks to Arthur, Matheus, and Carlos). Seeing the patches go to the mainline was great!
After adding the DRM KUnit tests to the upstream, we must maintain it working properly and try checking the reported bugs. For example, Guenter Roeck reported problems running tests on PowerPC, so I worked on a new patch to fix it in order to make things run smoothly. So, that’s about it for now!
You know what I’m about to talk about.
You knew it as soon as you opened up the page.
I’ve said I was done with it a number of times, but deep down we all knew that was a lie.
Let’s talk about XFB.
For newcomers to the blog, Zink has two methods of emitting streamout info:
The former is obviously the better option since it’s simpler. But also it has another benefit: it doesn’t need more variables. On the surface, it seems like this should just be the same as the first reason, namely that I don’t need to run some 300 line giga-function to wrangle the XFB outputs after the shader has ended.
There shouldn’t be any other reason. I’ve got the shader. I tell it to write some XFB data. Everything works as expected.
I know this.
You know this.
But then there’s someone we didn’t consult, isn’t there.
![]()
Obviously.
And when we do consult the spec, this seemingly-benign restriction is imposed:
VUID-StandaloneSpirv-Location-04916
The Location decorations must be used on user-defined variables
So any user-defined variable must have a location. Seems fine. Until that restriction applies to the explicit XFB outputs. The ones that are never counted as inter-stage IO and are eliminated by the Vulkan driver’s compiler for all purposes except XFB. And since locations are consumed, the restrictions for locations apply: maxVertexOutputComponents, maxTessellationEvaluationOutputComponents, and maxGeometryOutputComponents restrict the maximum number of locations that can be used.
And surely that would never be a problem.
It’s XFB, so obviously it’s a problem. The standard number of locations that can be relied upon for user variables is 32, which means a total of 128 components can be used for XFB. CTS specifically hits this in the Dragonball Z region of the test suite (Enhanced Layouts, for those of you who don’t speak GLCTS) with shaders that increase in complexity at a geometric rate.
Let’s take a look at one of the simpler ones out of the 800ish cases in KHR-Single-GL46.enhanced_layouts.xfb_struct_explicit_location:
#version 430 core
#extension GL_ARB_enhanced_layouts : require

layout(isolines, point_mode) in;

struct TestStruct {
   dmat3x4 a;
   double b;
   float c;
   dvec2 d;
};
struct OuterStruct {
    TestStruct inner_struct_a;
    TestStruct inner_struct_b;
};
layout (location = 0, xfb_offset = 0) flat out OuterStruct goku;

layout(std140, binding = 0) uniform Goku {
    TestStruct uni_goku;
};

void main()
{

    goku.inner_struct_a = uni_goku;
    goku.inner_struct_b = uni_goku;
}
This here is a tessellation evaluation shader that uses XFB on a very complex output type. Zink’s ability to inline such types is limited, which means Goku is about to throw that spirit bomb and kill off the chances of a clean CTS run.
The reasoning is how the XFB data is emitted. Rather than get a simple piece of shader info that says “output this entire struct with XFB”, Gallium instead provides the incredibly helpful struct pipe_stream_output_info data type:
/**
 * A single output for vertex transform feedback.
 */
struct pipe_stream_output
{
   unsigned register_index:6;  /**< 0 to 63 (OUT index) */
   unsigned start_component:2; /** 0 to 3 */
   unsigned num_components:3;  /** 1 to 4 */
   unsigned output_buffer:3;   /**< 0 to PIPE_MAX_SO_BUFFERS */
   unsigned dst_offset:16;     /**< offset into the buffer in dwords */
   unsigned stream:2;          /**< 0 to 3 */
};

/**
 * Stream output for vertex transform feedback.
 */
struct pipe_stream_output_info
{
   unsigned num_outputs;
   /** stride for an entire vertex for each buffer in dwords */
   uint16_t stride[PIPE_MAX_SO_BUFFERS];

   /**
    * Array of stream outputs, in the order they are to be written in.
    * Selected components are tightly packed into the output buffer.
    */
   struct pipe_stream_output output[PIPE_MAX_SO_OUTPUTS];
};
Each output variable is deconstructed into the number of 32-bit components that it writes (num_components) with an offset (start_component) and a zero-indexed “location” (register_index) which increments sequentially for all the variables output by the shader.
In short, it has absolutely no relation to the actual shader variables, and matching them back up is a considerable amount of work.
But this is XFB, so it was always going to be terrible no matter what.
Going back to the location disaster again, you might be wondering where the problem lies.
Let’s break it down with some location analysis. According to GLSL rules, here’s how locations are assigned for the output variables:
struct TestStruct {
   dmat3x4 a; <--this is effectively dvec3[4];
                 a dvec3 consumes 2 locations
                 so 4 * 2 is 8, so this consumes locations [0,7]
   double b; <--location 8
   float c; <--location 9
   dvec2 d; <--location 10
};
struct OuterStruct {
    TestStruct inner_struct_a; <--locations [0,10]
    TestStruct inner_struct_b; <--locations [11,21]
};
In total, and assuming I did my calculations right, 22 locations are consumed by this struct.
And this is zink, so point size must always be emitted, which means 23 locations are now consumed. This leaves 32 - 23 = 9 locations remaining for XFB.
Given that XFB works at the component level with tight packing, this means a minimum of 2 * (3 * 4) + 2 + 1 + 2 * 2 = 31 components are needed for each struct, but there’s two structs, which means it’s 62 components. And ignoring all other rules for a moment, it’s definitely true that locations are assigned in vec4 groupings, so a minimum of ceil(62 / 4) = 16 locations are needed to do explicit emission of this type.
But only 9 remain.
Whoops.
There’s a lot of ways to fix this.
The “best” way to fix it would be to improve/overhaul the inlining detection to ensure that crazy types like this are always inlined.
That’s really hard to do though, and the inlining code is already ridiculously complex to the point where I’d prefer not to ever touch it again to avoid jobbing like Vegeta in any future XFB battles.
The “easy” way to fix it would be to make the existing code work in this scenario without changing it. This is the approach I took, namely to decompose the struct before inlining so that the inline analysis has an easier time and can successfully inline all (or most) of the outputs.
It’s much simpler (and more accurate) to inline a shader that uses an output interface with no blocks like:
dmat3x4 a;
double b;
float c;
dvec2 d;
dmat3x4 a2;
double b2;
float c2;
dvec2 d2;
Thus the block splitting pass was created:
static bool
split_blocks(nir_shader *nir)
{
   bool progress = false;
   bool changed = true;
   do {
      progress = false;
      nir_foreach_shader_out_variable(var, nir) {
         const struct glsl_type *base_type = glsl_without_array(var->type);
         nir_variable *members[32]; //can't have more than this without breaking NIR
         if (!glsl_type_is_struct(base_type))
            continue;
         if (!glsl_type_is_struct(var->type) || glsl_get_length(var->type) == 1)
            continue;
         if (glsl_count_attribute_slots(var->type, false) == 1)
            continue;
         unsigned offset = 0;
         for (unsigned i = 0; i < glsl_get_length(var->type); i++) {
            members[i] = nir_variable_clone(var, nir);
            members[i]->type = glsl_get_struct_field(var->type, i);
            members[i]->name = (void*)glsl_get_struct_elem_name(var->type, i);
            members[i]->data.location += offset;
            offset += glsl_count_attribute_slots(members[i]->type, false);
            nir_shader_add_variable(nir, members[i]);
         }
         nir_foreach_function(function, nir) {
            bool func_progress = false;
            if (!function->impl)
               continue;
            nir_builder b;
            nir_builder_init(&b, function->impl);
            nir_foreach_block(block, function->impl) {
               nir_foreach_instr_safe(instr, block) {
                  switch (instr->type) {
                  case nir_instr_type_deref: {
                  nir_deref_instr *deref = nir_instr_as_deref(instr);
                  if (!(deref->modes & nir_var_shader_out))
                     continue;
                  if (nir_deref_instr_get_variable(deref) != var)
                     continue;
                  if (deref->deref_type != nir_deref_type_struct)
                     continue;
                  nir_deref_instr *parent = nir_deref_instr_parent(deref);
                  if (parent->deref_type != nir_deref_type_var)
                     continue;
                  deref->modes = nir_var_shader_temp;
                  parent->modes = nir_var_shader_temp;
                  b.cursor = nir_before_instr(instr);
                  nir_ssa_def *dest = &nir_build_deref_var(&b, members[deref->strct.index])->dest.ssa;
                  nir_ssa_def_rewrite_uses_after(&deref->dest.ssa, dest, &deref->instr);
                  nir_instr_remove(&deref->instr);
                  func_progress = true;
                  break;
                  }
                  default: break;
                  }
               }
            }
            if (func_progress)
               nir_metadata_preserve(function->impl, nir_metadata_none);
         }
         var->data.mode = nir_var_shader_temp;
         changed = true;
         progress = true;
      }
   } while (progress);
   return changed;
}
This is an simple pass that does three things:
The result is that it’s much rarer to need explicit XFB emission, and it’s generally easier to debug XFB problems involving shaders with struct blocks since the blocks will be eliminated.
Now as long as Goku doesn’t have any senzu beans remaining, I think this might actually be the last post I ever make about XFB.
Stay tuned next week for a more interesting and exciting post. Maybe.
Hi!
I’ve continued working on my IRC suite this month. Two of our extensions have been accepted in IRCv3: read-marker synchronizes read markers between multiple devices belonging to the same user, and channel-context adds a machine-readable tag to indicate the context of a message. Some other server and client developers have already implemented them!
soju has gained a few quality-of-life features. Thanks to gildarts, there is a
new channel update -detached flag to attach or detach a channel, a new
contrib/migrate-db script to migrate the database between backends, users can
now delete their own account, and the user password hashes are upgraded when
logging in. Additionally, read markers are broadcast using Web Push (to dismiss
notifications when a message is read on another client), users can now set a
default nickname to use for all networks, and the logic to regain the
configured nick should work on servers missing MONITOR support (so I should
no longer be stuck with “emersion_” on OFTC).
Goguma now supports irc:// URLs, so it should be easier to click on these links in various project pages. If the user hasn’t joined the target channel or network yet, a confirmation dialog will be displayed. In the network settings page, a new button opens a UI to authenticate on the IRC network. A ton of other minor fixes and improvements have been pushed as well.
I’ve released gamja 1.0 beta 6. This new version adds a settings dialog with options to customize how timestamps and chat events (join, part, and so on) are displayed.
In Wayland news, new Wayland and wayland-protocols releases have been shipped.
The Wayland release includes an axis_value120 event for high-resolution wheel
scrolling, the wayland-protocols releases includes the single-pixel-buffer and
the xdg-shell wm_capabilities event I’ve talked about last month. I’ve posted
a new color-representation protocol extension to improve YUV buffer
presentation.
Now for the mixed bag of miscellaneous updates. mako 1.7 has been released, it includes support for multiple modes, which should make it possible to e.g. create a light/dark mode and do-not-disturb mode without conflicts. kimchi now supports live reloading its configuration file (previously a restart was necessary). dalligi now mirrors sr.ht build logs on GitLab (as seen for instance in this wlroots pipeline). Last but not least, [hut] has gained better webhook support thanks to Thorben Günther, and a more complete export functionality thanks to Drew DeVault.
That’s all for this month! No NPotM this time, sadly. See you!
Citing official Adreno documentation:
[A Low Resolution Z (LRZ)] pass is also referred to as draw order independent depth rejection. During the binning pass, a low resolution Z-buffer is constructed, and can reject LRZ-tile wide contributions to boost binning performance. This LRZ is then used during the rendering pass to reject pixels efficiently before testing against the full resolution Z-buffer.
My colleague Samuel Iglesias did the initial reverse-engineering of this feature; for its in-depth overview you could read his great blog post Low Resolution Z Buffer support on Turnip.
Here are a few excerpts from this post describing what is LRZ?
To understand better how LRZ works, we need to talk a bit about tiled-based rendering. This is a way of rendering based on subdividing the framebuffer in tiles and rendering each tile separately.
The binning pass processes the geometry of the scene and records in a table on which tiles a primitive will be rendered. By doing this, the HW only needs to render the primitives that affect a specific tile when is processed.
The rendering pass gets the rasterized primitives and executes all the fragment related processes of the pipeline. Once it finishes, the resolve pass starts.
Where is LRZ used then? Well, in both binning and rendering passes. In the binning pass, it is possible to store the depth value of each vertex of the geometries of the scene in a buffer as the HW has that data available. That is the depth buffer used internally for LRZ. It has lower resolution as too much detail is not needed, which helps to save bandwidth while transferring its contents to system memory.
Thanks to LRZ, the rendering pass is only executed on the fragments that are going to be visible at the end.
LRZ brings a couple of things on the table that makes it interesting. One is that applications don’t need to reorder their primitives before submission to be more efficient, that is done by the HW with LRZ automatically.
Now, a year later, I returned to this feature to make some important improvements, for nitty-gritty details you could dive into Mesa MR#16251 “tu: Overhaul LRZ, implement on-GPU dir tracking and LRZ fast-clear”. There I implemented on-GPU LRZ direction tracking, LRZ reuse between renderpasses, and fast-clear of LRZ.
In this post I want to give a practical advice, based on things I learnt while reverse-engineering this feature, on how to help driver to enable LRZ. Some of it could be self-evident, some is already written in the official docs, and some cannot be found there. It should be applicable for Vulkan, GLES, and likely for Direct3D.
Or rather, when writing depth - do not change the direction of depth comparisons. If depth comparison direction is changed while writing into depth buffer - LRZ would have to be disabled.
Why? Because if depth comparison direction is GREATER - LRZ stores the lowest depth value of the block of pixels, if direction is LESS - it stores the highest value of the block. So if direction is changed the LRZ value becomes wrong for the new direction.
A few examples:
VK_COMPARE_OP_GREATER -> VK_COMPARE_OP_GREATER_OR_EQUAL is good;VK_COMPARE_OP_GREATER -> VK_COMPARE_OP_LESS is bad;VK_COMPARE_OP_GREATER with depth write -> VK_COMPARE_OP_LESS without depth write is ok;
The rules could be summarized as:
VK_COMPARE_OP_GREATER and VK_COMPARE_OP_GREATER_OR_EQUAL have same direction;VK_COMPARE_OP_LESS and VK_COMPARE_OP_LESS_OR_EQUAL have same direction;VK_COMPARE_OP_EQUAL and VK_COMPARE_OP_NEVER don’t have a direction, LRZ is temporally disabled;
VK_COMPARE_OP_EQUAL compares don’t benefit from LRZ;VK_COMPARE_OP_ALWAYS and VK_COMPARE_OP_NOT_EQUAL either temporally or completely disable LRZ, depending on depth being written.This obviously makes resulting depth value unpredictable, so LRZ has to be completely disabled.
Note, the output values of manually written depth could be bound by conservative depth modifier, for GLSL this is achieved by GL_ARB_conservative_depth extension, like this:
layout (depth_greater) out float gl_FragDepth;
However, Turnip at the moment does not consider this hint, and it is unknown if Qualcomm’s proprietary driver does.
All of them make a new fragment value depend on the old fragment value. LRZ is temporary disabled in this case.
Writing to SSBO, images, … from fragment shader forces late Z, thus it is incompatible with LRZ. At the moment Turnip completely disables LRZ when shader has such side-effects.
Discarding fragments moves the decision whether fragment contributes to the depth buffer to the time of fragment shader execution. LRZ is temporary disabled in this case.
TLDR: Since Snapdragon 865 (Adreno 650) LRZ supported in secondary command buffers.
TLDR: LRZ would work with VK_KHR_dynamic_rendering, but you’d like to avoid using this extension because it isn’t nice to tilers.
Official docs state that LRZ is disabled with “Use of secondary command buffers (Vulkan)”, and on another page that “Snapdragon 865 and newer will not disable LRZ based on this criteria”.
Why?
Because up to Snapdragon 865 tracking of the direction is done on the CPU, meaning that LRZ direction is kept in internal renderpass object, updated and checked without any GPU involvement.
But starting from Snapdragon 865 the direction could be tracked on GPU which allows driver not to know previous LRZ direction during a command buffer construction. Therefor secondary command buffers could now use LRZ!
Recently Vulkan 1.3 came out and mandated the support of VK_KHR_dynamic_rendering. It gets rid of complicated VkRenderpass and VkFramebuffer setup, but much more exciting is a simpler way for parallel renderpasses construction (with VK_RENDERING_SUSPENDING_BIT / VK_RENDERING_RESUMING_BIT flags).
VK_KHR_dynamic_rendering poses a similar challenge for LRZ as secondary command buffers and has the same solution.
TLDR: Since Snapdragon 865 (Adreno 650) LRZ would work if you store depth in one renderpass and load it later, giving depth image isn’t changed in-between.
Another major improvement brought by Snapdragon 865 is the possibility to reuse LRZ state between renderpasses.
The on-GPU direction tracking is part of the equation here, another part is the tracking of a depth view being used. Depth image has a single LRZ buffer which corresponds to a single array layer + single mip level of the image. So if view with different array layer or mip layer is used - LRZ state couldn’t be reused and will be invalidated.
With the above knowledge here are the conditions when LRZ state could be reused:
STORE_OP_STORE) at the end of some past renderpass;vkCmdBlitImage*, vkCmdCopyBufferToImage*, or vkCmdCopyImage*. Otherwise LRZ state would be invalidated;Misc notes:
vkCmdClearAttachments + LOAD_OP_LOAD is just equal to LOAD_OP_CLEAR.While there are many rules listed above - it all boils down to keeping things simple in the main renderpass(es) and not being too clever.
This week I was planning on talking about Device Mocking with KUnit, as I’m currently working on my first unit test for a physical device, the AMDGPU Radeon RX5700. I would introduce you to the Kernel Unit Testing Framework (KUnit), how it works, how to mock devices with it, and why it is so great to write tests.
But, my week was pretty more interesting due to a limitation on the KUnit Framework. This got me thinking about the Kernel Symbol Table and compilation for a while. So, I decided to write about it this week.
When starting the GSoC project, my fellow colleagues and I ran straight into a problem with the use of KUnit on the AMDGPU stack.
We would create a simple test, just like this one:
#include <kunit/test.h>
#include "inc/bw_fixed.h"

static void abs_i64_test(struct kunit *test)
{
	KUNIT_EXPECT_EQ(test, 0ULL, abs_i64(0LL));

	/* Argument type limits */
	KUNIT_EXPECT_EQ(test, (uint64_t)MAX_I64, abs_i64(MAX_I64));
	KUNIT_EXPECT_EQ(test, (uint64_t)MAX_I64 + 1, abs_i64(MIN_I64));
}

static struct kunit_case bw_fixed_test_cases[] = {
	KUNIT_CASE(abs_i64_test),
	{  }
};

static struct kunit_suite bw_fixed_test_suite = {
	.name = "dml_calcs_bw_fixed",
	.test_cases = bw_fixed_test_cases,
};

kunit_test_suite(bw_fixed_test_suite);
Ok, pretty simple test: just checking the boundary values for a function that returns the absolute value of a 64-bit integer. Nothing could go wrong…
And, at first, running the kunit-tool everything would go fine. But, if we tried to compile the test as a module, we would get a linking error:
Multiple definitions of 'init_module'/'cleanup_module' at kunit_test_suites().
This looks like a simple error, but if we think further this is a matter of kernel symbols and linking. So, let’s hop on and understand the basics of kernel symbols and linking. Finally, I will tell the end of this KUnit tell.
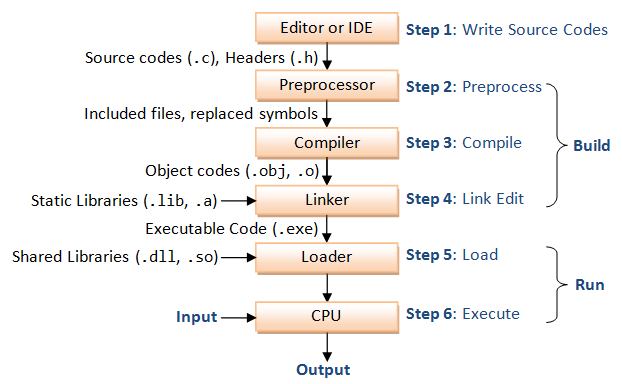
First, it is important to understand the stages of the compilation of a C program. If you’re a C-veteran, you can skip this section. But if you are starting in the C-programming world recently (or maybe just used to run make without thinking further), let’s understand a bit more about the compilation process for C programs - basically any compiled language.
The first stage of compilation is preprocessing. The preprocessor expands the included files - a.k.a. .h, expands the macros, and removes the comments. Basically, the preprocessor obeys to the directives, that is, the commands that begin with #.
The second stage of compilation is compiling. The compiling stage takes the preprocessor’s output and produces either assembly code or an object file as output. The object code contains the binary machine code that is generated from compiling the C source.
Then, we got to the linking stage. Linking takes one or more object files and produces the product of the final compilation. This output can be a shared library or an executable.
For our problem, the linking stage is the interesting one. In this stage, the linker links all the object files by replacing the references to undefined symbols with the appropriate addresses. So, at this stage, we get the missing definitions or multiple definitions errors.
When ld (or lld for those at the clang community), tells us that there are missing definitions, it means that either the definitions don’t exist, or that the object files or libraries where they reside are not provided to the linker. For the multiple definition errors, the linker is telling us that the same symbol was defined in two different object files or libraries.
So, going back to our error, we now know that:
init_module()/cleanup_module() twice.But, if you check the code, there is no duplicate of either of those functions. 🤔
Ok, now, let’s take a look at the kernel symbol table.
So, we keep talking about symbols. But now, we need to understand which symbols are visible and available to our module and which aren’t.
We can think of the kernel symbols in three levels of visibility:
So, by quoting the book Linux Kernel Development (3nd ed.), p. 348:
When modules are loaded, they are dynamically linked into the kernel. As with userspace, dynamically linked binaries can call only into external functions explicitly exported for use. In the kernel, this is handled via special directive called
EXPORT_SYMBOL()andEXPORT_SYMBOL_GPL(). Export functions are available for use by modules. Functions not exported cannot be invoked from modules. The linking and invoking rules are much more stringent for modules than code in the core kernel image. Core code can call any nonstatic interface in the kernel because all core source files are linked into a single base image. Exported symbols, of course, must be nonstatic, too. The set of exported kernel symbols are known as the exported kernel interfaces.
So, at this point, you can already get this statement, as you already understand about linking ;)
The kernel symbol table can be pretty important in debugging and you can check the list of symbols in a module with the nm command. Moreover, sometimes you want more than just the symbols from a module, but the symbols from the whole kernel. In this case, you can check the /proc/kallsyms file: it contains symbols of dynamically loaded modules as well as symbols from static code.
Also, during a kernel build, a file named Module.symvers will be generated. This file contains all exported symbols from the kernel and compiled modules. For each symbol, the corresponding CRC value, export type, and namespace are also stored.
Building an out-of-tree module is not trivial, and you can check the kbuild docs here, to understand more about symbols, how to install modules, and more.
Now, you have all the pieces needed to crack this puzzle. But I only gave you separate pieces of this problem. It’s time to bring these pieces together.
Let’s go back to the linking error we got at the test:
Multiple definitions of 'init_module'/'cleanup_module' at kunit_test_suites().
So, first, we need to understand how we are defining init_module multiple times. The first definition is at kunit_test_suites(). So, when building a KUnit test as a module, KUnit creates brand new module_init/exit_module functions.
But, think for a while with me… The amdgpu module, linked with our test, already defines a module_init function for the graphics module.
FYI: the
module_initis the module entry point when the module is loaded.
So, we have figured out the problem! We have one init_module at kunit_test_suites() and other init_module at amdgpu entry point, which is amdgpu_drv.c. And, as they are linked together, we have a linking problem!
And, how can we solve this problem?
Adding EXPORT_SYMBOL to all tested functions
Going back to the idea of the Kernel Symbol Table, we can load the amdgpu module and expose all the tested functions to any loadable module by adding EXPORT_SYMBOL. Then, we can compile the test module independently - that said, outside the amdgpu module - and loaded separately.
It feels like an easy fix, right? Not exactly! This would pollute the symbol namespace from the amdgpu module and also pollute the code. Polluting the code means more work to maintain and work with the code. So, this is not a good idea.
Incorporating the tests into the driver stack
Another idea is to call the tests inside the driver stack. So, inside the AMDGPU’s init_module function, we can call the KUnit’s private suite execution function and run the tests when the amdgpu module is loaded.
It is the strategy that some drivers, such as thunderbolt, were using. But, this introduces some incompatibilities with the KUnit tooling, as it makes it impossible to use the great kunit-tool and also doesn’t scale pretty well. If I want to have multiple modules with tests for a single driver, it would require the use of many #ifdef guards and the creation of awful init functions in multiple files.
Creating a test should be simple: not a huge structure with preprocessor directives and multiple files.
The previous solutions were a workaround for the real problem: KUnit was stealing module_init from other modules. For built-in tests, the kunit_test_suite() macro adds a list of suites in the .kunit_test_suites linker section. However, a module_init() function is used for kernel modules to run the test suites.
So, after some discussion on the KUnit Mailing List, Jeremy Kerr unified the module and non-module KUnit init formats. David Gow submitted a patch from him removing the KUnit-defined module inits, and instead parsing the KUnit tests from their own section in the module.
Now, the array of struct kunit_suite * will be placed in the .kunit_test_suites ELF section and the tests will run on the module load.
You can check the version 4 of this patchset.
Having this structure will make our work on GSoC much easier, and much cleaner! Huge thanks to all KUnit folks working on this great framework!
Getting this problem is not trivial! When it comes to compilation, linking, and, symbols, many CS students get pretty confused. In contrast, this is a pretty poetic part of computation: seeing these high-level symbols becoming simple assembly instructions and thinking about memory stacks.
If you are feeling a bit confused over this, I hugely recommend the Tanenbaum books and also Linux Kernel Development by Robert Love. Although Tanenbaum doesn’t write specifically about compilation, the knowledge of Compute Architecture and Operational Systems is fundamental to understanding the idea of running binaries on a machine.
After my last post, I received a very real, nonzero number of DMs bearing implications.
That’s right.
Messages like, “Nice blog post. I’m sure you totally know how to use RenderDoc.” and “Nice RenderDoc tutorial.” as well as “You don’t know how to use RenderDoc, do you?”
I even got a message from Baldur “Dr. Render” Karlsson asking to see my RenderDoc operator’s license. Which I definitely have. And it’s not expired.
I just, uh, don’t have it on me right now, officer.
But we can work something out, right?
Right?
So I’m writing this post of my own free will, and in it we’re going to take a look at a real bug. Using RenderDoc.
Like a tutorial, but less useful.
If you want a real tutorial, you should be contacting Danylo Piliaiev, Professor Emeritus at Render University, for his self-help guide. Or watch his free zen meditation tutorial. Powerful stuff.
First, let’s open up the renderdoc capture for this bug:

What’s that? I skipped the part where I was supposed to describe how to get a capture?
Fine, fine, let’s go back.
If you’re not already a maestro of the most powerful graphics debugging tool on the planet, the process for capturing a frame on zink goes something like this:
LD_PRELOAD=/usr/lib64/librenderdoc.so MESA_LOADER_DRIVER_OVERRIDE=zink <executable>
I’ve been advised by my lawyer to state for the record that preloading the library in this manner is Not Officially Supported, and the GUI should be used whenever possible. But this isn’t a tutorial, so you can read the RenderDoc documentation to set up the GUI capture.
Moving along, if the case in question is a single frame apitrace, as is the case for this bug, there’s some additional legwork required:
LD_PRELOAD=/usr/lib64/librenderdoc.so MESA_LOADER_DRIVER_OVERRIDE=zink glretrace --loop portal2.trace
In particular here, the --loop parameter will replay the frame infinitely, enabling capture. There’s also the need to use F11 to cycle through until the Vulkan window is selected. And also possibly to disable GL support in RenderDoc so it doesn’t get confused.
But this isn’t a tutorial, so I’m gonna assume that once the trace starts playing at this point, it’s easy enough for anyone following along to press F11 a couple times to select Vulkan and then press F12 to capture the frame.
This is more or less what RenderDoc will look like once the trace is opened:
Assuming, of course, that you are in one of these scenarios:
Running on Lavapipe, the interface looks more like this since Lavapipe has no bugs and all bugs disappear when running it:

Incredible.
If you’re new to the blog, I’ve included a handy infographic to help you see the problem area in the ANV capture:

That’s all well and good, you might be saying, but how are you going to solve this problem?
The first step when employing this tool is to locate a draw call which exhibits the problem that you’re attempting to solve. This can be done in the left pane by scrolling through the event list until the texture viewer displays a misrender.
I’ve expedited the process by locating a problem draw:

This pile of rubble is obviously missing the correct color, so the hunt begins.
With the draw call selected, I’m going to first check the vertex output data in the mesh viewer. If the draw isn’t producing the right geometry, that’s a problem.

I’ve dragged the wireframe around a bit to try and get a good angle on it, but all I can really say is that it looks like a great pile of rubble. Looks good. A+ to whoever created it. Probably have some really smart people on payroll at a company like that.
The geometry is fine, so the color output must be broken. Let’s check that out.
First, go back to the texture viewer and right click somewhere on that rubble heap. Second, click the Debug button at the bottom right.

You’re now in the shader debugger. What an amazing piece of software this is that you can just debug shaders.
I’m going to do what’s called a “Pro Gamer Move” here since I’ve taken Danylo Piliaiev’s executive seminar in which he describes optimal RenderDoc usage as doing “what my intuition tells me”. Upon entering the debugger, I can see the shader variables being accessed, and I can immediately begin to speculate on a problem:

These vertex inputs are too big. Probably. I don’t have any proof that they’re not supposed to be non-normalized floats, but probably they aren’t, because who uses non-normalized floats?
Let’s open up the vertex shader by going to the pipeline inspector view, clicking the VS bubble, then clicking Edit → Decompile with SPIRV-Cross:

This brings up the vertex shader, decompiled back to GLSL for readability, where I’m interested to see the shader’s inputs and outputs:

Happily, these are nicely organized such that there are 3 inputs and 3 outputs which match up with the fragment shader locations in the shader debugger from earlier, using locations 1, 2, 3. Having read through the shader, we see that each input location corresponds to the same output location. This means that broken vertex input data will yield broken vertex output data.
Here’s where the real Pro Gamer Move that I totally used at the time I was originally solving this issue comes into play. Notice that the input variables are named with a specific schema. v0 is location 0. v2, however, is location 1, v3 is location 2, and v4 is location 3.
Isn’t that weird?
We’re all experts here, so we can agree that it’s a little weird. The variables should probably be named v0, v1, v2, v3. That would make sense. I like things that make sense.
In this scenario, we have our R E F E R E N C E driver, Lavapipe, which has zero bugs and if you find them they’re your fault, so let’s look at the vertex shader in the same draw call there:

O
M
G
I was right. On my own blog. Nobody saw this coming.
So as we can see, in Lavapipe, where everything renders correctly, the locations do correspond to the variable names. Is this the problem?
Let’s find out.
RenderDoc, being the futuristic piece of software that it is, lets us make changes like these and test them out.
Going back to the ANV capture and the vertex shader editing pane, I can change the locations in the shader and then compile and run it:

Which, upon switching to the texture viewer, yields this:

Hooray, it’s fixed. And if we switch back to the Vertex Input viewer in the pipeline inspector:

The formats here for the upper three attributes have also changed, which explains the problem. Also though there actually were non-normalized floats for some of the attributes, so my wild guess ended up only being partially right.
It wasn’t like I actually stepped through the whole fragment shader to see which inputs were broken and determined that oT6 in (broken) location 3 was coming into the shader with values far too large to ever produce a viable color output.
That would be way less cool than making a wild conjecture that happened to be right like a real guru would do.
This identified the problem, but it didn’t solve it. Zink doesn’t do its own assignment for vertex input locations and instead uses whatever values Gallium assigns, so the bug had to be somewhere down the stack.
Given that the number of indices used in the draw call was somewhat unique, I was able to set a breakpoint to use with gdb, which let me:
v1) that was deleted early on without reserving a locationv1 should have reserved location 1, thus offsetting every subsequent vertex attribute by 1, which yields the correct renderingAnd, like magic, I solved the issue.
But I didn’t fix it.
This isn’t a tutorial.
I’m just here so I don’t get fined.
Being part of the community, is more than just writing code and sending patches, it is also keeping track of the IRC discussions and reading the mailing lists to review and test patches sent from others whenever you can.
Both environments are not the most welcoming, but there are plenty of tools from the community to help parsing them. In this post I’ll talk about b4, suggested by my GSOC mentor André, a tool to help with applying patches.
I assume you already know that when we refer to “git commits”, we are basically talking about snapshots of the files in the repository (more about that); it’s almost like, for each set of changes, we archived and compressed the whole repository folder an gave the result a name.
When working in a large project with so many people, like we have in the Linux Kernel community, it would be impractical to send a file containing the whole repository just to show some changes in some files, specially in the old days, when there probably wasn’t even that much bandwidth. So, in order to share your workings with the community you just have to tell them “add X to line N, remove Y from the following line”, in other words, you have to share only the differences you brought to the code.
There is a command to convert your commits into these messages showing only the “diffs” in your code: git format-patch. It’s worth mentioning that Git uses its own enhanced format of diff (see git diff), which tries to humanize and contextualize some changes, either by recognizing scopes in some languages or simply including surrounding lines in the output. So, lets say you created a couple commits based on master and want to extract them as patches, you could run git format-patch master, which would create a couple numbered files. You could then send them via email with git send-mail, but that’s another talk, my point here was just to introduce the concept of patches, you can read more at https://git-scm.com/book/en/v2/Distributed-Git-Maintaining-a-Project.
Now, lets say somebody has already sent their patch to some mailing list, like https://lore.kernel.org/all/[email protected]/. How can you assert that their code compiles and works as described?
You could find the link and download the mbox.gz file from the lore.kernel.org page, or find the series at patchwork.kernel.org to do the same, which then would allow you to use git am to apply the patches, recreating the commits in your local environment. That process is easy enough but it can be improved as far as running a command over the lore.kernel.org URL with b4.
B4 is a Python package and can be easily installed with python3 -m pip install --user b4. I’d suggest using a virtual environment to avoid problems with dependencies, but this post won’t cover that.
It comes with a helpful b4 --help, which tells us that, to apply the mentioned patch series you’d just need to run:
b4 am https://lore.kernel.org/all/[email protected]/
Which will download the patch series as a mbox file and the cover letter as another, so that you could then use git am on it the former. With some luck (and communication), everything will apply without any conflicts.
That’s it, good luck on your reviews and thanks for reading!
“applying patch to belly” by The EnergySmart Academy is licensed under CC BY-NC-SA 2.0. To view a copy of this license, visit https://creativecommons.org/licenses/by-nc-sa/2.0/?ref=openverse.
NGG (Next Generation Geometry) is the technology that is responsible for any vertex and geometry processing in AMD RDNA GPUs. I decided to do a write-up about my experience implementing it in RADV, which is the Vulkan driver used by many Linux systems, including the Steam Deck. I will also talk about shader culling on RDNA GPUs.
Let’s start by briefly going over how the old GCN geometry pipeline works, so that we can compare old and new.
GCN GPUs have 5 programmable hardware shader stages for vertex/geometry processing: LS, HS, ES, GS, VS. These HW stages don’t exactly map to the software stages that are advertised in the API. Instead, it is the responsibility of the driver to select which HW stages need to be used for a given pipeline. We have a table if you want details.
The rasterizer can only consume the output from HW VS, so the last SW stage in your pipeline must be compiled to HW VS. This is trivial for VS and TES (yes, tess eval shaders are “VS” to the hardware), but GS is complicated. GS outputs are written to memory. The driver has no choice but to compile a separate shader that runs as HW VS, and copies this memory to the rasterizer. We call this the “GS copy shader” in Mesa. (It is not part of the API pipeline but required to make GS work.)
Notes:
The next-generation geometry pipeline vastly simplifies how the hardware works. (At the expense of some increased driver complexity.)
There are now only 2 HW shader stages for vertex/geometry processing:
The surface shader is not too interesting, it runs the merged SW VS + TCS when tessellation is enabled. I’m not aware of any changes to how this works compared to old HW.
The interesting part, and subject of much discussion on the internet is the primitive shader.
In some hardware documentation and register header files the new stage is referred to as simply “GS”,
because AMD essentially took what the GS stage could already do and added the ability for it to
directly feed the rasterizer using exp (export) instructions.
Don’t confuse this with SW GS.
It supports a superset of the functionality that you can do in software VS, TES, GS and MS.
In very loose terms you can think about it as a “mesh-like” stage which all these software stages can be compiled to.
Compared to the old HW VS, a primitive shader has these new features:
s_sendmsg(gs_alloc_req) which ensures that the necessary amount of space
in the parameter cache is allocated for them.Software VS and TES:
Compared to the legacy pipeline, the compiled shaders must now not only export vertex output attributes
for a fixed number of vertices, but instead they
create vertices/primitives (after declaring how many they will create).
This is trivial to implement because all they have to do is read the registers that contain the input primitive
topology and then export the exact same topology.
Software GS:
As noted above, each NGG shader invocation can only create up to 1 vertex + up to 1 primitive.
This mismatches the programming model of SW GS and makes it difficult to implement.
In a nutshell, for SW GS the hardware launches a large enough workgroup to fit every possible
output vertex. This results in poor HW utilization (most of those threads just sit there doing nothing
while the GS threads do the work), but there is not much we can do about that.
Mesh shaders:
The new pipeline enables us to support mesh shaders, which was simply impossible on the legacy pipeline,
due to how the programming model entirely mismatches anything the old hardware could do.
We did some benchmarks when we switched RADV and ACO to use the new pipeline. We found no significant perf changes. At all. Considering all the hype we heard about NGG at the hardware launch, I was quite surprised.
However, after I set the hype aside, it was quite self-explanatory. When we switched to NGG, we still compiled our shaders mostly the same way as before, so even though we used the new geometry pipeline, we didn’t do anything to take advantage of its new capabilities.
The actual perf improvement came after I also implemented shader-based culling.
The NGG pipeline makes it possible for shaders to know about input primitives and create an arbitrary topology of output primitives. Even though the API does not make this information available to application shaders, it is possible for driver developers to make their compiler aware of it and add some crazy code that can get rid of primitives when it knows that those will never be actually visible. The technique is known as “shader culling”, or “NGG culling”.
This can improve performance in games that have a lot of triangles, because we only calculate the output positions of every vertex before we decide which triangle to remove. We then also remove unused vertices.
The benefits are:
If there is interest, I may write a blog post about the implementation details later.
Due to how all of this reduces certain bottlenecks, its effectiveness very highly depends on whether you actually had a bottleneck in the first place. How many primitives it can remove of course depends on the application. Therefore the exact percentage of performance gain (or loss) also depends on the application.
If an application didn’t have any of the aforementioned bottlenecks or already mitigates them in its own way, then all of this new code may just add unnecessary overhead and actually slightly reduce performance rather than improve it.
Other than that, there is some concern that a shader-based implementation may be less accurate than the fixed-function HW.
Shader culling seems to be most efficient in benchmarks and apps that output a lot of triangles without having any in-app solution for dealing with the bottlenecks. It is also very effective on games that suffer from overtessellation (ie. create a lot of very small triangles which are not visible).
While shader culling can also work on RDNA1, we don’t enable it by default because we haven’t yet found a game that noticably benefits from it. On RDNA1, it seems that the old and new pipelines have similar performance.
The main takeaway from this post is that NGG is not a performance silver bullet that magically makes all your games faster. Instead, it is an enabler of new features. It lets the driver implement new techniques such as shader culling and new programming models like mesh shaders.
A quick update on my latest activities around V3DV: I’ve been focusing on getting the driver ready for Vulkan 1.2 conformance, which mostly involved fixing a few CTS tests of the kind that would only fail occasionally, these are always fun :). I think we have fixed all the issues now and we are ready to submit conformance to Khronos, my colleague Alejandro Piñeiro is now working on that.
Who else out there knows the feeling of opening up a bug ticket, thinking Oh, I fixed that, and then closing the tab?
Don’t lie, I know you do it too.
Such was the case when I (repeatedly) pulled up this ticket about a rendering regression in Dirt Rally.

To me, this is a normal, accurate photo of a car driving along a dirt track in the woods. A very bright track, sure, but it’s plainly visible, just like the spectators lining the sides of the track.
The reporter insisted there was a bug in action, however, so I strapped on my snorkel and oven mitt and got to work.
For the first time.
Last week.
We all remember our first bug. It’s usually “the code didn’t compile the first time I tried”. The worst bug there is.
The first bug I found in pursuit of this so-called rendering anomaly was not a simple compile error. No, unfortunately the code built and ran fine thanks to Mesa’s incredible and rock-stable CI systems (this was last week), which meant I had to continue on this futile quest to find out whatever was wrong.
Next, I looked at the ticket again and downloaded the trace, which was unfortunately provided to prevent me from claiming that I didn’t have the game or couldn’t find it or couldn’t launch it or was too lazy. Another unlucky roll of the dice.
After sitting through thirty minutes of loading and shader compiling in the trace, I was treated to another picturesque view of a realistic racing environment:

B-e-a-u-tiful.
If this is a bug, I don’t want to know what it’s supposed to look like.
Nevertheless, I struggled gamely onward. The first tool in any driver developers kit is naturally RenderDoc, which I definitely know how to use and am an expert in wielding for all manner of purposes, the least of which is fixing trivial “bugs” like this one. So I fired up RenderDoc—again, without even the slightest of troubles since I use it all the time and it works great for doing all the things I want it to do—got my package of frame-related data, and then loaded it up in QRenderDoc.
And, of course, QRenderDoc crashed because that was what I wanted it to do. It’s what I always want it to do, really.
But, regrettably, the legendary Baldur Karlsson is on my team and can fix bugs faster than I can report them, so I was unable to continue claiming I couldn’t proceed due to this minor inconvenience for long. I did my usual work in RenderDoc, which I won’t even describe because it took such a short amount of time due to my staggering expertise in the area and definitely didn’t result in finding any more RenderDoc bugs, and the result was clear to me: there were no zink bugs anywhere.
I did, however, notice that descriptor caching was performing suboptimally such that only the first descriptor used for UBOs/SSBOs was used to identify the cache entry, so I fixed that in less time than it took to describe this entire non-bug nothingburger.
I want you to look at the original image above, then look at this one here:

To me, these are indistinguishable. If you disagree, you are nitpicking and biased.
But now I was getting pile-on bug reports: if zink were to run out of BAR memory while executing this trace, again there was this nebulous claim that “bugs” occurred.
My skepticism was at a regular-time average after the original report yielded nothing but fixes for RenderDoc, so I closed the tab.
I did some other stuff for most of the week that I can’t remember because it was all so important I stored the memories somewhere safe—so safe that I can’t access them now and accidentally doodle all over them, but I was definitely very, very busy with legitimate work—but then today I decided to be charitable and give the issue a once-over in case there happened to be some merit to the claims.
Seriously though, who runs out of BAR memory? Doesn’t everyone have a GPU with 16GB of BAR these days?
I threw in a quick hack to disable BAR access in zink’s allocator and loaded up the trace again.

As we can see here, the weather is bad, so there are fewer spectators out to spectate, but everything is totally fine and bug-free. Just as expected. Very realistic. Maybe it was a little weird that the spectators were appearing and disappearing with each frame, but then I remembered this was the Road To The Haunted House track, and naturally such a track is haunted by the ghosts of players who didn’t place first.
At a conceptual level, I knew it was nonsense to be considering such things. I’m an adult now, and there’s no scientific proof that racing games can be haunted. Despite this, I couldn’t help feel a chill running down my fingers as I realized I’d discovered a bug. Not specifically because of anything I was doing, but I’d found one. Entirely independently. Just by thinking about it.
Indeed, by looking at the innermost allocation function of zink’s suballocator, there’s this bit of vaguely interesting code:
VkResult ret = VKSCR(AllocateMemory)(screen->dev, &mai, NULL, &bo->mem);
if (!zink_screen_handle_vkresult(screen, ret)) {
   if (heap == ZINK_HEAP_DEVICE_LOCAL_VISIBLE) {
      heap = ZINK_HEAP_DEVICE_LOCAL;
      mesa_loge("zink: %p couldn't allocate memory! from BAR heap: retrying as device-local", bo);
      goto demote;
   }
   mesa_loge("zink: couldn't allocate memory! from heap %u", heap);
   goto fail;
}
This is the fallback path for demoting BAR allocations to device-local. It works great. Except there’s an obvious bug for anyone thinking about it.
I’ll give you a few moments since it was actually a little tricky to spot.
By now though, you’ve all figured it out. Obviously by performing the demotion here, the entire BO is demoted to device-local, meaning that suballocator slabs get demoted and then cached as BAR, breaking the whole thing.
Terrifying, just like the not-at-all-haunted race track.
I migrated the demotion code out a couple layers so the resource manager could handle demotion, and the footgun was removed before it could do any real harm.
Just to pass the time while I waited to see if an unrelated CI pipeline would fail, I decided to try running CTS with BAR allocations disabled. As everyone knows, if CTS fails, there’s a real bug somewhere, so it would be easy to determine whether there might be any bugs that were totally unrelated to the reports in this absolute lunatic’s ticket.
Imagine my surprise when I did, in fact, find failing test cases. Not anything related to the trace or scenario in the ticket, of course, since that’s not a test case, it’s a game, and my parents always told me to be responsible and stop playing games.
It turns out there were some corner case bugs that nothing had been hitting until now. The first one of these was in the second-worst place I could think of: threaded context. Debugging problems here is always nightmarish for varying reasons, though mostly because of threads.
The latest problem in question was that I was receiving a buffer_map call on a device-local buffer with the unsynchronized flag set, meaning that I was unable to use my command buffer. This was fine in the case where I was discarding any pre-existing data on the buffer, but if I did have data I wanted to save, I was screwed.
Well, not me specifically, but my performance was definitely not going to be in a good place since I’d have to force a thread sync and…
Anyway, this was bad, and the cause was that the is_resource_busy call from TC was never passing along the unsynchronized flag, which prevented the driver from accurately determining whether the resource was actually busy.
With that fixed, I definitely didn’t find any more issues whatsoever.
Except that I did.
They required the complex understanding of what some would call “basic arithmetic”, however, so I’m not going to get into them. Suffice to say that buffer copies were very subtly broken in a couple ways.
I win.
I didn’t explicitly set out to prove this bug report wrong, but it clearly was, and there are absolutely no bugs anywhere so don’t even bother trying to find them.
And if you do find them, don’t bother reporting them because it’s not like anyone’s gonna fix them.
And if someone does fix them, it’s not like they’re gonna spend hours pointlessly blogging about it.
And if someone does spend hours pointlessly blogging about it, it’s not like anyone will read it anyway.
Hi!
Yesterday I’ve finally finished up and merged push notification support for the soju IRC bouncer and the goguma Android client! Highlights & PM notifications should now be delivered much more quickly, and power consumption should go down. Additionally, the IRC extension isn’t tied to a proprietary platform (like Google or Apple) and the push notification payloads are end-to-end encrypted. If you want to read more about the technical details, have a look at the IRCv3 draft.
In the Wayland world, we’re working hard to get ready for the next wlroots release. We’ve merged numerous improvements for the scene-graph API, xdg-shell v3 and v4 support has been added (to allow xdg-popups to change their position), and a ton of other miscellaneous patches have been merged. Special thanks to Kirill Primak, Alexander Orzechowski and Isaac Freund!
I’ve also been working on various Wayland protocol bits. The
single-pixel-buffer extension allows clients to easily create buffers with a
single color instead of having to go through wl_shm. The security-context
extension will make it possible for compositors to reliably detect sandboxed
clients and apply special policies accordingly (e.g. limit access to screen
capture protocols). Thanks for xdg-shell capabilities clients will be able to
hide their maximize/minimize/fullscreen buttons when these actions are not
supported by the compositor. Xaver Hugl’s content-type extension will enable
rules based on the type of the content being displayed (e.g. enable adaptive
sync when a game is displayed, or make all video player windows float). Last,
I’ve been working on some smaller changes to the core protocol: a new
wl_surface.configure event to atomically apply a
surface configuration, and a new wl_surface.buffer_scale
event to make the compositor send the preferred scale factor instead of letting
the clients pick it.
I’ve tried to help Jason “I’m literally writing an NVIDIA compiler as I read Mike Blumenkrantz’s blog” Ekstrand with his explicit synchronization work. I’ve written a kernel patch to make it easier for user-space to check whether Jason’s new shiny IOCTLs are available. Unfortunately Greg K-H didn’t like the idea of using sysfs for IOCTL advertisement, and we didn’t find any other good solution, so I’ve merged Jason’s patches as-is and user-space needs to perform a kernel version check. At least I’ve learned how to add sysfs entries! If you want to learn more about Jason’s work, he’s written a blog post about it.
Progress is steady on the libdisplay-info front. I like taking a break from the complicated Linux graphics issues by writing a small patch to parse a new section of the EDID data structure. Don’t get me wrong, EDID is a total mess, but at least I don’t need to think too much when writing a parser. Pekka and Sebastian have been providing very good feedback. Sometimes I complain about their reviews being too nitpicky, but I’m sure I wouldn’t do better should the roles be reversed.
The NPotM is wlspeech, a small Wayland input method to write text using your voice. It leverages Mozilla’s DeepSpeech library for the voice recognition logic. It’s very basic at the moment: it just listens for 2 seconds, and then types the text it’s recognized. It would be nice to switch to ALSA’s non-blocking API, to add a hotkey to trigger the recording, give feedback about the currently recognized word via pre-edit text. Let me know if you’re interested in working on this.
That’s all for today, see you next month!
Recently I’ve heard from a friend that his professor simply doesn’t believe that free software should be profitable, so I’m making this blog post.
Of course, I don’t just want to rub it in his face, I’m also here to talk about my Google Summer of Code project :). Let’s hop into it!
DISCLAIMER:
For those who don’t know, at the moment of writing this I also work with open source at Red Hat, and of course it is a profitable business otherwise I’d be unemployed. Notice the context here is very different though as Red Hat not only provides source code for their projects but also many other products related to systems maintenance and services, such as customer assistance and maintenance of customer’s product’s infrastructure.
It should be also noted that this blog is in no way what-so-ever related to Red Hat or any of its subsidiaries, and conveys my personal opinion only.
Now we can proceed :).
For thy poor readers who don’t already know about this, Google Summer of Code (GSoC for the intimate) is an annual initiative for encouraging people (mainly students) to contribute to open source software projects all around, and there are many organizations that take part on it, submitting their mentors’ ideas as possible projects, then parsing through to-be-contributors proposals.
Let me explain this in more detail, so you can catch that carp next year:
By the way, I’ve already explained how you can find a local community and, possibly even mentors on them in a previous blog post, so go check it out if you’re not really sure how to approach these situations.
The most obvious ways Google has to incentivize contributions are, of course, through money, and also by utilizing their massive reputation to connect people (that is, contributors and mentors). Now we get a little more philosophical: why does Google, of all companies in the world, sponsor random people to contribute to open source?
The implications of this tell us a lot about software engineering, idealistic thinking, and even capitalism itself!
As you might already know, many of these projects exist not only for their own sake, but as reliable, auditable, building blocks for larger projects, or even as tools, making it very easy and cheap (money-wise and also time-wise) to create whatever you might want. So it happens that by having this sort of, at first glance, unreasonably undervalued (most times literally free!) tools we can build much more valuable software and/or media at exponential rates, because the only thing holding us back is the knowledge to yield them.
Then, as our current financial system much rather values competing alternatives
in an open battle market, it makes a lot of sense for some of this stuff to
be as widely available as possible.
We, of course, can also look at this through idealistic lenses: free (libre) software objectively makes the world a better place because
That is to say that the real advantage in all of this is that we can make the world a better place for everyone, one commit at a time, and with almost no barriers to entry!
If you’d never thought about this, of course we have some problems here.
First and foremost, the most obvious issue happens when such software is not maintained properly (maintainers may lack resources, for example), and as it might be used by many other projects we might have a broken dependency chain. This has happened recently with Log4j and it’s caused a huge turmoil.
Still onto this issue, we’re never totally sure if the code has been audited properly. Sometimes maintainers also aren’t as experienced as we’d hope, and end up making mistakes.
A huge chunk of this problem happens primarily when projects aren’t so interesting and have small user base, or when its maintainers lack appeal (e.g. they might be blunt on community interactions) and, as a consequence, cannot build a proper community around it.
This is a problem that large corporations can usually deal with in their products, as they can just select competent developers and pay them good money to maintain literally depressing code bases.
Another problem is having bloated or unruly software. Of course this isn’t exclusive to open source (just look at Microsoft Windows for example), but it can be made worse, as maintainers might have different views on what’s important and no consensus as to which path to follow.
Using the Linux kernel as an example, even with Linus as the head of the project it still has had a history of too many ABI changes2 3 and still has many issues caused simply by leaving code “unattended” (i.e. introduction of hypocrite commits, or easy to solve compilation warnings that were simply overlooked).
This might have been a product of overworked maintainers who have no time to review every piece of every patch, coupled with their trust onto familiar developers who have no better ways to check if their contributions are up to a certain threshold than to run some scripts on them or wait for some CI to fail and warn them.
This might not be the full picture of upsides vs downsides, but it’s certainly one which I’ve been very exposed to recently, so that’s my take on it.
I recommend having a look at Rosenzweig’s blog post for a more in depth discussion on issues regarding licensing and open source software.
With all of this in mind, I personally believe that as starters in this contribution journey the most valuable thing we can give back to maintainers is to provide fixes for overlooked problems, or even better, provide ways to help more experienced developers make better code.
What do I mean with this? Simply put
It’s literally that simple!
What gets to me is that those are usually very simple things, and a new contributor might want to make contributions as heavy as those they see maintainers making. But that’s just not realistic for most newbies.
And of course it’s a lot less interesting to send PRs adding a test than it is to upstream emoji support for Intel graphics drivers, but you often gotta start small, kiddo.
So, onto my GSoC project, what the hell am I even doing?
As alluded to above, I’m adding tests to graphics drivers in the kernel. Specifically to the AMDGPU driver, which is a ginourmous beast of a thing, being literally the largest in the Linux kernel currently. Of course that with great powers come great headaches and so it happens that the AMD driver for its GPUs has many shady pieces of code, and a core representative of which is its DML submodule that, roughly speaking, is responsible for providing the absolute best timing values for internal GPU components, and it achieves this through a series of unorthodox floating point calculations.
For the matter, I’ll specifically be working with this file, wish me luck!
Another thing that makes it an absolute nightmare to deal with is that floating point routines are simply not welcomed in Linux’s kernel code. No one likes to even review that.
Of course some kernels (like Window’s) do have floating point support, and there’s no strong argument to not have it nowadays, as modern CPUs are pretty well optimized for this – just look at modern SIMD instruction sets for example (SSE2 onwards) –, and as a matter of fact, modern GPUs can perform just the same whether we’re using them for integers or floating point numbers!
All of this conspires to a perpetual state of “just let it be” (perpetuated by the engineers themselves…), and we end up with bloated, hard-to-read routines, which are unfortunately core to their most cutting-edge GPUs.
Such is the rabbit hole I got into! But not alone, mind you,
Maíra Canal and
Thales Aparecida
will be joining me for lots of crying in the bathroom I mean FUN! Lots
of fun! Magali Lemes will also be joining our
party while doing her final work for undergrad, so stay tuned :).
I also managed to clone my mentor, Rodrigo Siqueira, and now I have three! Starring: Melissa Wen and André Almeida!
I hope to learn a lot, being in such great company, and with them, we should be able to at least “sweep” some piles of sand from under AMD’s GPU driver carpet (or so I hope).
If you’re wondering what exactly we’re proposing, you can look at my project submission1, but in short we should be creating tests for some DML files, which is a task that in itself already encompasses many technical obstacles, like testing in real hardware, or mocking it, and also ensuring that these tests are compatible with IGT, which I’ll talk about in my next blog post. We’re also concerned with generating coverage reports for the tests, refactoring these monstrous files, and documenting them better.
Last but not least, GSoC also appreciates community presence, so you should see more stuff around here, and I’ve also set up an IRC bouncer to stay up-to-date 24/7 with some communities (ping me [isinyaaa] anytime on #dri-devel if you wish 😊).
See you later alligator!
My GSoC proposal. If you want to see it in full, just ping me and I’ll be happy to share :).
The first step to eliminate bugs is to find a way how to reproduce them consistently. Wait… what?
Test suites are great for that, since they can simulate very specific behavior in a timely manner. IGT GPU Tools is a collection of tools for development and testing of the DRM drivers, and, as such, it can help us to find and reproduce bugs.
I intend to help expand the AMDGPU tests’ list in my the GSoC project, so it made sense trying to run them right away. Cloned and built the IGT project then tried to run the “amdgpu” tests using a TTY in text mode:
$ ./scripts/run-tests.sh -t ".*amdgpu.*"
Unfortunately, the tests failed and never came to a stop. I tried interrupting the process using different techniques but, in the end, had to reboot pressing the Reset button. Looking through the partial results I found that one of the subtests of amd_cs_nop was causing the problem… But why weren’t the test just failing or crashing?
In an attempt to debug what was happening inside the subtest I enabled the DRM debugging messages with:
echo 0x19F | sudo tee /sys/module/drm/parameters/debug
This mask activates all debugging logs but “verbose vblank” and “verbose atomic state”. Unfortunately, again, this debugging logs only managed to show me, with my limited knowledge, that something had been locked in an infinite loop.
After sharing my experience with my mentors, they assured me the problem was probably caused by the kernel code itself, not with my setup or my compilation .config. So, to pinpoint what part of the code was causing the problem I could look through space (stepping throughout the calls with gdb) or time (using git) and I choose the latter.
So now the plan was to find when the bug was introduced. Luckily it wasn’t so hard, a single git checkout to the previous release in the amd-staging-drm-next branch, which was v5.16, only 1000 commits or so behind the HEAD of the branch. It might seem like a lot to go through, but our time-machine is quite fast: git bisect.
According to Wikipedia, the bisection method is a root-finding method that applies to any continuous function for which one knows two values with opposite signs. You probably already know it as binary-search. In this case, we are searching for the first commit in which the test fails, so to start our journey
git bisect start
git bisect bad # HEAD
git bisect good v5.16
And with it, git informs us there will be around 10 steps and checks out to the middle of those commits. For each step, build, deploy, reboot into the new kernel and run tests. Quite tedious and time consuming. Right now, I’m not sure I could do it in a QEMU environment, but certainly, if I ever need to bisect the kernel in the future I’ll look into it, because in that case I would be able to use git bisect run, which would allow the whole process to be automatized.
In the end, the whole process took a full afternoon… just to find myself in a failed bisection. I had the misfortune of making some mistake in the middle of the road, probably skipping the build step by accident due to a compiling error, and marked a commit with the wrong flag. After restarting the bisect in the following day, I made sure to avoid my mistake be renaming each build with the short hash of the commit I was compiling. And finally 🎉, found the first broken commit: https://gitlab.freedesktop.org/agd5f/linux/-/commit/e68efb27647f2106d6b545667f35b2ea39746b57
Well… at least, I found the commit where the amd_cs_nop started failing. It looks promising, given it handles a mutex lock, and my mentors think so as well. Next step was reporting the bug, by simply creating an issue following the “BUG template” given at https://gitlab.freedesktop.org/drm/amd/-/issues/:
And that’s that. Thanks for reading. ❤️
“Repair Bug” by AZRainman is licensed under CC BY 2.0. To view a copy of this license, visit https://creativecommons.org/licenses/by/2.0/?ref=openverse.
I’m a Fedora fan. I mean: I have two laptops for development, and all of them run Fedora. I also have a deployment machine. Guess what? It runs Fedora. Stickers? The Fedora Logo sticked forever on my laptop.
So, by now, you know: I’m really a Fedora fan.
So, when I started working with Linux Kernel, I really wanted to develop in a Fedora environment. But, without any kind of script, the work of a Linux Kernel developer is ungrateful. I mean, do you want to deploy to a remote machine? Be ready for network configurations, grub configurations, generate initramfs image, and tons of commands. Do you want to manage your config files? Basically, you are back to the ancient times when many save tons of config files on folders.
So, it’s a tremendous setup overhead. But, there is a tool to unify all this infrastructure: the kworkflow.
Kworkflow is great. It unifies all tools for sending email, managing configs, debugging, and deploying. The Problem? It didn’t use to have support for Fedora.
As a defender of the Fedora ecosystem, I couldn’t let that go, I had a mission: bring support for Fedora to kw.
Ok, first of all, you need to understand my case of love for Fedora.
My first Linux distribution was Pop_OS!. It was great until they made the update to Cosmic. And I hated Cosmic with all my guts. I felt cheated by System76 (and if you check Reddit, you gonna see that it wasn’t only me). My computer was now slow, crashing and I simply hated all those buttons. I missed my classic and simple GNOME and I couldn’t understand how a company could go so against its community.
So, I ended up changing it for Fedora 34. Yes, my first Fedora…
And it was simply perfect: simple and plain GNOME 40 and moreover, Fedora is a bleeding-edge distribution. Fedora is always on the rollout for the latest Linux features, driver updates, and software. It is very innovative: Fedora comes with Wayland and Pipewire out-of-the-box, for example. And, although it is very innovative, it is incredibly stable.
But, we didn’t solve up the problem of Red Hat simply making a disgusting change and the community simply hate it. In fact, we did! Fedora is incredibly democratic. The Fedora community is the most important part of the development of another version and any change is submitted to the community through a proposal.
And that’s why I love Fedora so much: stability, innovation, and a great community.
But, if none of that convinced you to move to Fedora, maybe Linus Torvalds does. It is a pretty known fact that the creator of Linux is a Fedora user.
Fedora is great, but… It didn’t use to have kw support. I couldn’t let that go. So, I started to work on the kw support for Fedora.
First of all, we needed to make it possible to install kw on a Fedora system with the setup.sh script. This was pretty simple after all: I just needed to add a package dependency list to the kw files and specify how to install those packages, so basically dnf.
To get the dependencies, I based myself on the Arch Linux dependency list. If you are willing to check more on this feature, check the PR.
So, now the biggest challenge for me: introduce kw deploy for Fedora.
The first step was to learn how to install a custom kernel in a Fedora distribution manually, how to generate the initramfs and what was the default bootloader and how to update it.
Fedora has great documentation, so I check out the guide Building a Custom Kernel.
On Fedora, to build the kernel, you run:
make oldconfig
make bzImage
make modules
And them, to install the kernel, you run:
sudo make modules_install
sudo make install
But, there is a small detail: we don´t want simply to install the kernel on your local system, we want to deploy remotely.
So, we must generate the initramfs, and send it to the remote machine. The mechanism to send the modules and the initramfs was already coded on kw. So, I had only one task: find out how Fedora generates its initramfs.
I found out an article from Fedora Magazine that explained how Fedora uses dracut to generate the initramfs. To generate the initramfs, it is as simple as running:
dracut --force --kver {KERNEL_NAME}
Next step, check out the default bootloader for Fedora. Fedora uses GRUB2, as is can be seen in this article. So, it looked straightly simple for me as kw already had GRUB support.
But, all the GRUB support on kw was based on the grub-mkconfig command and Fedora comes with the grub2-mkconfig command. So, the first thing I had to work on was adding support to the grub2-mkconfig command on kw, as I found it unfair to simply install another GRUB package on the system of the kw user.
That said, I based myself on the Debian deployment script and wrote the Fedora deployment script with the specific Fedora tools: dracut and dnf.
But a new problem arrived: GRUB menu didn’t seem to show up on my machine. And I found out that Fedora comes with GRUB hidden by default. To display GRUB, you must run:
grub2-editenv - unset menu_auto_hide
Ok, now GRUB showed up, but the newly compiled kernel didn’t show up in the GRUB menu. So, I found out that Fedora comes with GRUB_ENABLE_BLSCFG set by default. It was pretty simple to fix this, simply run:
sed -i -e 's/GRUB_ENABLE_BLSCFG=true/GRUB_ENABLE_BLSCFG=false/g' /etc/default/grub
And that’s it! Now, kw d worked like a charm with Fedora. I tested on my local machine with Fedora 35 and remotely with Fedora 35 and Fedora 36.
If you wanna check this feature out, take a look at this PR.
As I said, I have two development laptops: a Lenovo IdeaPad and a Dell Inspiron 15. Lenovo is my less powerful notebook, so I basically always carry him in my backpack. And the Dell Inspiron is my precious baby: it is an Intel Core i7, with 16 GB DRAM and Nvidia graphics.
Moreover, I have a testing machine, with an AMD Radeon RX 5700 XT 50th Anniversary. This is where I run my kernel tests (especially, graphics tests) and run IGT GPU Tools.
The problem? Setup up a network with three machines without becoming a cable hell. That’s why I use Tailscale to connect all my machines through a network. It’s a great tool for people with multiple machines.
Next step: make deployment easy and simple. Basically, I want to compile the Kernel on my Dell Inspiron 15 and deploy it to my testing machine through the network.
First thing: have a good config file.
I manage my config files through kw configm and I have three config files: STD_DCN_CONFIG, KUNIT_CONFIG, and STD_CONFIG.
The STD_DCN_CONFIG has enabled AMDGPU drivers and DCN stuff, with the addition of TCP configurations to make Tailscale work properly. Also, I use BTRFS as my Filesystem (as it comes out of the box with Fedora), so I also had to configure the FS.
The KUNIT_CONFIG is almost the same as STD_DCN_CONFIG, but with the addition of the KUNIT module. As I’m working in GSoC, this is my go-to config recently.
And the STD_CONFIG is the config that comes with Fedora. I don’t use it that much. It’s pretty loaded with modules and it takes too long to compile.
Ok, now it’s time to compile it. kw has a great tool to build Linux images, kw b, but it doesn’t support clang yet (but, Isa is working on it). So, as I like to use the LLVM system and use ccache to speed up builds, I run:
make CC="ccache clang" -j8
Great! Now we have a vmlinuz image. But, we still need to deploy it. Now, kw really shines for me. I simply run kw d with reboot setup on my kworkflow.config and, that’s it. I simply go to my deployment machine and choose a kernel to boot from.
It is incredibly simple, right?
Hope I have inspired you to try out Fedora 36 and kw! These great tools will make your development simple and fast.
My next step with Fedora: introduce kw to the dnf package manager. But that’s a talk to another post.
Written by Richard Hughes and Christian F.K. Schaller
This blog post is based on a white paper style writeup Richard and I did a few years ago, since I noticed this week there wasn’t any other comprehensive writeup online on the topic of how to add the required metadata to get an application to appear in GNOME Software (or any other major open source appstore) online I decided to turn the writeup into a blog post, hopefully useful to the wider community. I tried to clean it up a bit as I converted it from the old white paper, so hopefully all information in here is valid as of this posting.
Traditionally we have had little information about Linux applications before they have been installed. With the creation of a software center we require access to rich set of metadata about an application before it is deployed so it it can be displayed to the user and easily installed. This document is meant to be a guide for developers who wish to get their software appearing in the Software stores in Fedora Workstation and other distributions. Without the metadata described in this document your application is likely to go undiscovered by many or most linux users, but by reading this document you should be able to relatively quickly prepare you application.

Installing applications on Linux has traditionally involved copying binary and data files into a directory and just writing a single desktop file into a per-user or per-system directory so that it shows up in the desktop environment. In this document we refer to applications as graphical programs, rather than other system add-on components like drivers and codecs. This document will explain why the extra metadata is required and what is required for an application to be visible in the software center. We will try to document how to do this regardless of if you choose to package your application as a rpm package or as a flatpak bundle. The current rules is a combination of various standards that have evolved over the years and will will try to summarize and explain them here, going from bottom to top.
Traditionally applications on Linux are expected to install binary files to /usr/bin, the install architecture independent data files to /usr/share/ and configuration files to /etc. If you want to package your application as a flatpak the prefix used will be /app so it is critical for applications to respect the prefix setting. Small temporary files can be stored in /tmp and much larger files in /var/tmp. Per-user configuration is either stored in the users home directory (in ~/.config) or stored in a binary settings store such as dconf. As an application developer never hardcode these paths, but set them following the XDG standard so that they relocate correctly inside a Flatpak.
Desktop files have been around for a long while now and are used by almost all Linux desktops to provide the basic description of a desktop application that your desktop environment will display. Like a human readable name and an icon.
So the creation of a desktop file on Linux allows a program to be visible to the graphical environment, e.g. KDE or GNOME Shell. If applications do not have a desktop file they must be manually launched using a terminal emulator. Desktop files must adhere to the Desktop File Specification and provide metadata in an ini-style format such as:
The desktop file should be installed into /usr/share/applications for applications that are installed system wide. An example desktop file provided below:
[Desktop Entry]

Type=Application

Name=OpenSCAD

Icon=openscad

Exec=openscad %f

MimeType=application/x-openscad;

Categories=Graphics;3DGraphics;Engineering;

Keywords=3d;solid;geometry;csg;model;stl;
The desktop files are used when creating the software center metadata, and so you should verify that you ship a .desktop file for each built application, and that these keys exist: Name, Comment, Icon, Categories, Keywords and Exec and that desktop-file-validate correctly validates the file. There should also be only one desktop file for each application.
The application icon should be in the PNG format with a transparent background and installed in
/usr/share/icons,/usr/share/icons/hicolor//apps/, or /usr/share/${app_name}/icons/*. The icon should be at least 128×128 in size (as this is the minimum size required by Flathub).
The file name of the desktop file is also very important, as this is the assigned ‘application ID’. New applications typically use a reverse-DNS style, e.g. org.gnome.Nautilus would be the app-id. And the .desktop entry file should thus be name org.gnome.Nautilus.desktop, but older programs may just use a short name, e.g. gimp.desktop. It is important to note that the file extension is also included as part of the desktop ID.
You can verify your desktop file using the command ‘desktop-file-validate’. You just run it like this:
desktop-file-validate myapp.desktop
This tools is available through the desktop-file-utils package, which you can install on Fedora Workstation using this command
dnf install desktop-file-utils
You also need what is called a metainfo file (previously known as AppData file= file with the suffix .metainfo.xml (some applications still use the older .appdata.xml name) file should be installed into /usr/share/metainfo with a name that matches the name of the .desktop file, e.g. gimp.desktop & gimp.metainfo.xml or org.gnome.Nautilus.desktop & org.gnome.Nautilus.metainfo.xml.
In the metainfo file you should include several 16:9 aspect screenshots along with a compelling translated description made up of multiple paragraphs.
In order to make it easier for you to do screenshots in 16:9 format we created a small GNOME Shell extension called ‘Screenshot Window Sizer’. You can install it from the GNOME Extensions site.
Once it is installed you can resize the window of your application to 16:9 format by focusing it and pressing ‘ctrl+alt+s’ (you can press the key combo multiple times to get the correct size). It should resize your application window to a perfect 16:9 aspect ratio and let you screenshot it.
Make sure you follow the style guide, which can be tested using the appstreamcli command line tool. appstreamcli is part of the ‘appstream’ package in Fedora Workstation.:
appstreamcli validate foo.metainfo.xml
If you don’t already have the appstreamcli installed it can be installed using this command on Fedora Workstation:
dnf install appstreamWhat is allowed in an metainfo file is defined in the AppStream specification but common items typical applications add is:
A typical (albeit somewhat truncated) metainfo file is shown below:
<?xml version="1.0" encoding="UTF-8"?>

<component type="desktop-application">

<id>org.gnome.Terminal</id>

<metadata_license>GPL-3.0+ or GFDL-1.3-only</metadata_license>

<project_license>GPL-3.0+</project_license>

<name>Terminal</name>

<name xml:lang="ar">الطرفية</name>

<name xml:lang="an">Terminal</name>

<summary>Use the command line</summary>

<summary xml:lang="ar">استعمل سطر الأوامر</summary>

<summary xml:lang="an">Emplega la linia de comandos</summary>

<description>

<p>GNOME Terminal is a terminal emulator application for accessing a UNIX shell environment which can be used to run programs available on your system.</p>

<p xml:lang="ar">يدعم تشكيلات مختلفة، و الألسنة و العديد من اختصارات لوحة المفاتيح.</p>

<p xml:lang="an">Suporta quantos perfils, quantas pestanyas y implementa quantos alcorces de teclau.</p>

</description>

<recommends>

<control>console</control>

<control>keyboard</control>

<control>pointing</control>

</recommends>

<screenshots>

<screenshot type="default">https://help.gnome.org/users/gnome-terminal/stable/figures/gnome-terminal.png</screenshot>

</screenshots>

<kudos>

<kudo>HiDpiIcon</kudo>

<kudo>HighContrast</kudo>

<kudo>ModernToolkit</kudo>

<kudo>SearchProvider</kudo>

<kudo>UserDocs</kudo>

</kudos>

<content_rating type="oars-1.1"/>

<url type="homepage">https://wiki.gnome.org/Apps/Terminal</url>

<project_group>GNOME</project_group>

<update_contact>https://wiki.gnome.org/Apps/Terminal/ReportingBugs</update_contact>

</component>
The Appstream specification is an mature and evolving standard that allows upstream applications to provide metadata such as localized descriptions, screenshots, extra keywords and content ratings for parental control. This intoduction just touches on the surface what it provides so I recommend reading the specification through once you understood the basics. The core concept is that the upstream project ships one extra metainfo XML file which is used to build a global application catalog called a metainfo file. Thousands of open source projects now include metainfo files, and the software center shipped in Fedora, Ubuntu and OpenSuse is now an easy to use application filled with useful application metadata. Applications without metainfo files are no longer shown which provides quite some incentive to upstream projects wanting visibility in popular desktop environments. AppStream was first introduced in 2008 and since then many people have contributed to the specification. It is being used primarily for application metadata but also now is used for drivers, firmware, input methods and fonts. There are multiple projects producing AppStream metadata and also a number of projects consuming the final XML metadata.
When applications are being built as packages by a distribution then the AppStream generation is done automatically, and you do not need to do anything other than installing a .desktop file and an metainfo.xml file in the upstream tarball or zip file. If the application is being built on your own machines or cloud instance then the distributor will need to generate the AppStream metadata manually. This would for example be the case when internal-only or closed source software is being either used or produced. This document assumes you are currently building RPM packages and exporting yum-style repository metadata for Fedora or RHEL although the concepts are the same for rpm-on-OpenSuse or deb-on-Ubuntu.
NOTE: If you are building packages, make sure that there are not two applications installed with one single package. If this is currently the case split up the package so that there are multiple subpackages or mark one of the .desktop files as NoDisplay=true. Make sure the application-subpackages depend on any -common subpackage and deal with upgrades (perhaps using a metapackage) if you’ve shipped the application before.
So the steps outlined above explains the extra metadata you need to have your application show up in GNOME Software. This tutorial does not cover how to set up your build system to build these, but both for Meson and autotools you should be able to find a long range of examples online. And there are also major resources available to explain how to create a Fedora RPM or how to build a Flatpak. You probably also want to tie both the Desktop file and the metainfo file into your i18n system so the metadata in them can be translated. It is worth nothing here that while this document explains how you can do everything yourself we do generally recommend relying on existing community infrastructure for hosting source code and packages if you can (for instance if your application is open source), as they will save you work and effort over time. For instance putting your source code into the GNOME git will give you free access to the translator community in GNOME and thus increase the chance your application is internationalized significantly. And by building your package in Fedora you can get peer review of your package and free hosting of the resulting package. Or by putting your package up on Flathub you get wide cross distribution availability.
We will here explain how you set up a Yum repository for RPM packages that provides the needed metadata. If you are making a Flatpak we recommend skipping ahead to the Flatpak section a bit further down.
When GNOME Software checks for updates it downloads various metadata files from the server describing the packages available in the repository. GNOME Software can also download AppStream metadata at the same time, allowing add-on repositories to include applications that are visible in the the software center. In most cases distributors are already building binary RPMS and then building metadata as an additional step by running something like this to generate the repomd files on a directory of packages. The tool for creating the repository metadata is called createrepo_c and is part of the package createrepo_c in Fedora. You can install it by running the command:
dnf install createrepo_c.
Once the tool is installed you can run these commands to generate your metadata:
$ createrepo_c --no-database --simple-md-filenames SRPMS/

$ createrepo_c --no-database --simple-md-filenames x86_64/
This creates the primary and filelist metadata required for updating on the command line. Next to build the metadata required for the software center we we need to actually generate the AppStream XML. The tool you need for this is called appstream-builder. This works by decompressing .rpm files and merging together the .desktop file, the .metainfo.xml file and preprocessing the icons. Remember, only applications installing AppData files will be included in the metadata.
You can install appstream builder in Fedora Workstation by using this command:
dnf install libappstream-glib-builder
Once it is installed you can run it by using the following syntax:
$ appstream-builder \
   --origin=yourcompanyname \
   --basename=appstream \
   --cache-dir=/tmp/asb-cache \
   --enable-hidpi \
   --max-threads=1 \
   --min-icon-size=32 \
   --output-dir=/tmp/asb-md \
   --packages-dir=x86_64/ \
   --temp-dir=/tmp/asb-icons
This takes a few minutes and generates some files to the output directory. Your output should look something like this:
Scanning packages...

Processing packages...

Merging applications...

Writing /tmp/asb-md/appstream.xml.gz...

Writing /tmp/asb-md/appstream-icons.tar.gz...

Writing /tmp/asb-md/appstream-screenshots.tar...Done!
The actual build output will depend on your compose server configuration. At this point you can also verify the application is visible in the yourcompanyname.xml.gz file.
We then have to take the generated XML and the tarball of icons and add it to the repomd.xml master document so that GNOME Software automatically downloads the content for searching.
This is as simple as doing:
modifyrepo_c \
    --no-compress \
    --simple-md-filenames \
    /tmp/asb-md/appstream.xml.gz \
    x86_64/repodata/
modifyrepo_c \
    --no-compress \
    --simple-md-filenames \
    /tmp/asb-md/appstream-icons.tar.gz \
    x86_64/repodata/
Deploying this metadata will allow GNOME Software to add the application metadata the next time the repository is refreshed, typically, once per day. Hosting your Yum repository on Github Github isn’t really set up for hosting Yum repositories, but here is a method that currently works. So once you created a local copy of your repository create a new project on github. Then use the follow commands to import your repository into github.
cd ~/src/myrepository

git init

git add -A

git commit -a -m "first commit"

git remote add origin [email protected]:yourgitaccount/myrepo.git

git push -u origin master
Once everything is important go into the github web interface and drill down in the file tree until you find the file called ‘repomd.xml’ and click on it. You should now see a button the github interface called ‘Raw’. Once you click that you get the raw version of the XML file and in the URL bar of your browser you should see a URL looking something like this:
https://raw.githubusercontent.com/cschalle/hubyum/master/noarch/repodata/repomd.xml
Copy that URL as you will need the information from it to create your .repo file which is what distributions and users want in order to reach you new repository. To create your .repo file copy this example and edit it to match your data:
[remarkable]

name=Remarkable Markdown editor software and updates

baseurl=https://raw.githubusercontent.com/cschalle/hubyum/master/noarch

gpgcheck=0

enabled=1

enabled_metadata=1
So on top is your Repo shortname inside the brackets, then a name field with a more extensive name. For the baseurl paste the URL you copied earlier and remove the last bits until you are left with either the ‘norach’ directory or your platform directory for instance x86_64. Once you have that file completed put it into /etc/yum.repos.d on your computer and load up GNOME Software. Click on the ‘Updates’ button in GNOME Software and then on the refresh button in the top left corner to ensure your database is up to date. If everything works as expected you should then be able to do a search in GNOME software and find your new application showing up.

The flatpak-builder binary generates AppStream metadata automatically when building applications if the appstream-compose tool is installed on the flatpak build machine. Flatpak remotes are exported with a separate ‘appstream’ branch which is automatically downloaded by GNOME Software and no addition work if required when building your application or updating the remote. Adding the remote is enough to add the application to the software center, on the assumption the AppData file is valid.
AppStream files allow us to build a modern software center experience either using distro packages with yum-style metadata or with the new flatpak application deployment framework. By including a desktop file and AppData file for your Linux binary build your application can be easily found and installed by end users greatly expanding its userbase.
After my last blog post I was so exhausted I had to take a week off, but I’m back. In the course of my blog-free week, I remembered the secret to blogging: blog before I start real work for the day.
It seems obvious, but once that code starts flowing, the prose ain’t coming.
It’s been a busy couple weeks.
As I mentioned, I’ve been working on getting zink running on an Adreno chromebook using turnip—the open source Qualcomm driver. When I first fired up a CTS run, I was at well over 5000 failures. Today, two weeks later, that number is closer to 150. Performance in SuperTuxKart, the only app I have that’s supposed to run well, is a bit lacking, but it’s unclear whether this is anything related to zink. Details to come in future posts.
Some time ago I implemented dmabuf support for lavapipe. This is finally landing, assuming CI doesn’t get lost at the pub on the way to ramming the patches into the repo. Enjoy running Vulkan-based display servers in style. I’m still waiting on Cyberpunk to finish loading, but I’m planning to test out a full lavapipe system once I finish the game.
Also in lavapipe-land, 1.3 conformance submissions are pending. While 1.2 conformance went through and was blogged about to great acclaim, this unfortunately can’t be listed in main or a current release since the driver has 1.2 conformance but advertises 1.3 support. The goalpost is moving, but we’ve got our hustle shoes on.
On occasion I manage to get real work done. A couple weeks ago, in the course of working on turnip support, I discovered something terrible: Qualcomm has no 64bit shader support.
This is different from old-time ANV, where 64bit support isn’t in the hardware but is still handled correctly in the backend and so everything works even if I clumsily fumble some dmat3 types into the GPU. On Qualcomm, such tomfoolery is Not Appreciated and will either fail or just crash altogether.
So how well did 64bit -> 32bit conversions work in zink?
Not well.
Very not well.
Before I get into all the methods by which zink fails, let’s talk about it at a conceptual level: what 64bit operations are needed here?
There are two types of 64bit shader operations, Int64 and Float64. At the API level, these correspond to doing 64bit integer and 64bit float operations respectively. At the functional level, however, they’re a bit different. Due to how zink handles shader i/o, Int64 is what determines support for 64bit descriptor interfaces as well as cross-stage interfaces. Float64 is solely for handling ALU operations involving 64bit floating point values.
With that in mind, let’s take a look at all the ways this failed:
Basically everything.
Oops.
There’s a lot of code involved in addressing all these issues, so rather than delving too deeply into it (you can see the MR here), I’ll go over the issues at a pseudo code level.
Like a whiteboard section of an interview.
Except useful.
First, let’s take a look at descriptor handling. This is:
All of these are handled in two phases. Initially, the load/store operation is rewritten. This involves two steps:
array<uint> variables)As expected, at least one of these was broken in various ways.
Offset handling was, generally speaking, fine. I got something right.
What I didn’t get right, however, was the 64bit rewrites. While certain operations were being converted, I had (somehow) failed to catch the case of missing Int64 support as a place where such conversions were required, and so the rewrites weren’t being done. With that fixed, I discovered even more issues:
The first issue was simple to fix: instead of doing manual bitshifts and casts, use NIR intrinsics like nir_op_pack_64_2x32 to handle rewrites since these can be optimized out upon meeting a matching nir_op_unpack_64_2x32 later on.
The second issue was a little trickier, but it mostly just amounted to forcing scalarization during the rewrite process to avoid issues.
Except there were other issues, because of course there were.
Some of the optimization passes required for all this to work properly weren’t handling atomic load/store ops correctly and were deleting loads that occurred after atomic stores. This spawned a massive amount of galaxy brain-level discussion that culminated in some patches that might land someday.
So with all this solved, there were only a couple issues remaining.
How hard could it be?
Anyway, so there were more issues, but really it was just two issues:
Tackling the first issue first, the way I saw it, 64bit variables had to be rewritten into expanded (e.g., dvec2 -> vec4) types and then load/store operations had to be rewritten to split the values up and write to those types. My plan for this was:
This obviously hit a snag with the larger types (e.g., dvec3, dvec4) where there was more than a vec4 of expanded components. I ended up converting these to a struct containing vec4 members that could then be indexed based on the offset of the original load.
But hold on, Jason “I’m literally writing an NVIDIA compiler as I read your blog post” Ekstrand is probably thinking, what about even bigger types, like dmat3?
I’m so glad you asked, Jason.
The difference with a 64bit matrix type is that it’s treated as an array<dvec> by NIR, which means that the access chain goes something like:
That intermediate step means indexing from a struct isn’t going to work since the array index might not be constant.
It’s not going to work, right?

It turns out that if you use the phi, anything is possible.
Here’s a taste of how 64bit matrix loads are handled:
/* matrix types always come from array (row) derefs */
assert(deref->deref_type == nir_deref_type_array);
nir_deref_instr *var_deref = nir_deref_instr_parent(deref);
/* let optimization clean up consts later */
nir_ssa_def *index = deref->arr.index.ssa;
/* this might be an indirect array index:
 * - iterate over matrix columns
 * - add if blocks for each column
 * - phi the loads using the array index
 */
unsigned cols = glsl_get_matrix_columns(matrix);
nir_ssa_def *dests[4];
for (unsigned idx = 0; idx < cols; idx++) {
   /* don't add an if for the final row: this will be handled in the else */
   if (idx < cols - 1)
      nir_push_if(&b, nir_ieq_imm(&b, index, idx));
   unsigned vec_components = glsl_get_vector_elements(matrix);
   /* always clamp dvec3 to 4 components */
   if (vec_components == 3)
      vec_components = 4;
   unsigned start_component = idx * vec_components * 2;
   /* struct member */
   unsigned member = start_component / 4;
   /* number of components remaining */
   unsigned remaining = num_components;
   /* component index */
   unsigned comp_idx = 0;
   for (unsigned i = 0; i < num_components; member++) {
      assert(member < glsl_get_length(var_deref->type));
      nir_deref_instr *strct = nir_build_deref_struct(&b, var_deref, member);
      nir_ssa_def *load = nir_load_deref(&b, strct);
      unsigned incr = MIN2(remaining, 4);
      /* repack the loads to 64bit */
      for (unsigned c = 0; c < incr / 2; c++, comp_idx++)
         comp[comp_idx] = nir_pack_64_2x32(&b, nir_channels(&b, load, BITFIELD_RANGE(c * 2, 2)));
      remaining -= incr;
      i += incr;
   }
   dest = dests[idx] = nir_vec(&b, comp, intr->num_components);
   if (idx < cols - 1)
      nir_push_else(&b, NULL);
}
/* loop over all the if blocks that were made, pop them, and phi the loaded+packed results */
for (unsigned idx = cols - 1; idx >= 1; idx--) {
   nir_pop_if(&b, NULL);
   dest = nir_if_phi(&b, dests[idx - 1], dest);
}
I just saw Big Triangle reaching for a phone, probably to call the police regarding illegal amounts of compiler horseplay, so let’s move on so I can maybe finish this before I get hauled off.
The only remaining issue now is
Look, there’s a reason why entire blog posts are devoted to the awfulness of XFB.
It’s bad.
Really bad.
I’m not going to go deep into the changes required. They’re terrible. The gist of it is that zink utilizes two mechanisms to handle XFB, and one is worse than the other. That one is the “manual emission” handler, in which the output of a variable is read back and then explicitly stored to an XFB output. This has to handle all the variable types (in spirv) for both the load and the store, and then it also has to untangle the abomination that is Gallium XFB handling, and it’s just terrible.
But it’s done.
And with it comes the marking off of a ton of CTS failures for turnip and other platforms that lack 32bit support.
So it begins!
With some pushes and pulls from friends, I’ve been studying the Linux Graphical stack for some time now. After some minor patches to both Mesa and the Linux Kernel, I followed the instructions thoroughly and landed a successful Google Summer of Code proposal:
My project’s primary goal is to create unit tests using KUnit for the AMDGPU driver focused on the Display and Compositing Engine (DCE) 11.2, which will be tested on the GPU “RX 580”.
The motivation for that comes not only to assert that the APIs work as expected, but also to keep their behavior stable across minor changes in their code, which can allow for great improvement to the code readability and maintainability.
For the implementation of the tests, we decided to go with the Kernel Unit Testing Framework (KUnit). KUnit makes it possible to run test suites on kernel boot or load the tests as a module. It reports all test case results through a TAP (Test Anything Protocol) in the kernel log.
There is a great probability that KUnit will have some limitations in regards to testing GPU’s drivers’ functions, so the secondary goal will be to enhance its capabilities. There will be other people working with KUnit on DCN in parallel, so there will be a lot of code review to be done as well. I will keep track of my weekly progress on my blog, reporting the challenges I will face and trying to create an introductory material that could help future newcomers.
During this summer I’ll have by my side Isabella Basso and Maíra Canal, sharing an overall similar GSOC proposal but working with DCN, which is used by newer GPUs, and Magali Lemes, working on her related capstone project. We all will be mentored by three awesome FLOSS contributors:
When talking about FLOSS, communication must be plenty and time-travel compatible 🙃!
Jokes aside, the two main channels to chat and exchange patches are IRC and mailing lists, respectively.
Right now, I’m still overwhelmed by the volume of emails arriving (even after setting some filters). Searching for relevant threads at lore.kernel.org has proven useful. Right now, I’m subscribed to:
IRC is an important tool used by the community to keep in touch real time. Similar to old-school chat rooms, there’s no chat history by default, so, to circumvent that, I’ve been using thelounge kindly deployed by André, which acts not only as an IRC web client but also a IRC bouncer, meaning that it keeps me connected and stores any messages while I’m away.
I’ve joined the following IRC channels:
#kunit-usp: Where daily discussions from our team are being held, in portuguese.#kunit: Kunit development channel.#kw-devel: Kworkflow development channel.#dri-devel: Pretty active channel shared by Mesa and Kernel graphics (filled with light hearted people, highly recommend!).#freedesktop: freedesktop.org infrastructure and online services.#radeon: Support and development for open-source radeon/amdgpu drivers.#xorg-devel: X.Org development discussion.“Happy Birthday Penguin Cake” by foamcow is licensed under CC BY-NC-SA 2.0. To view a copy of this license, visit https://creativecommons.org/licenses/by-nc-sa/2.0/?ref=openverse.
In recent days I have been testing how modifying the default CPU and GPU frequencies on the rpi4 increases the performance of our reference Vulkan applications. By default Raspbian uses 1500MHz and 500MHz respectively. But with a good heat dissipation (a good fan, rpi400 heat spreader, etc) you can play a little with those values.
One of the tools we usually use to check performance changes are gfxreconstruct. This tools allows you to record all the Vulkan calls during a execution of an aplication, and then you can replay the captured file. So we have traces of several applications, and we use them to test any hypothetical performance improvement, or to verify that some change doesn’t cause a performance drop.
So, let’s see what we got if we increase the CPU/GPU frequency, focused on the Unreal Engine 4 demos, that are the more shader intensive:

So as expected, with higher clock speed we see a good boost in performance of ~10FPS for several of these demos.
Some could wonder why the increase on the CPU frequency got so little impact. As I mentioned, we didn’t get those values from the real application, but from gfxreconstruct traces. Those are only capturing the Vulkan calls. So on those replays there are not tasks like collision detection, user input, etc that are usually handled on the CPU. Also as mentioned, all the Unreal Engine 4 demos uses really complex shaders, so the “bottleneck” there is the GPU.
Let’s move now from the cold numbers, and test the real applications. Let’s start with the Unreal Engine 4 SunTemple demo, using the default CPU/GPU frequencies (1500/500):
Even if it runs fairly smooth most of the time at ~24 FPS, there are some places where it dips below 18 FPS. Let’s see now increasing the CPU/GPU frequencies to 1800/750:
Now the demo runs at ~34 FPS most of the time. The worse dip is ~24 FPS. It is a lot smoother than before.
Here is another example with the Unreal Engine 4 Shooter demo, already increasing the CPU/GPU frequencies:
Here the FPS never dips below 34FPS, staying at ~40FPS most of time.
It has been around 1 year and a half since we announced a Vulkan 1.0 driver for Raspberry Pi 4, and since then we have made significant performance improvements, mostly around our compiler stack, that have notably improved some of these demos. In some cases (like the Unreal Engine 4 Shooter demo) we got a 50%-60% improvement (if you want more details about the compiler work, you can read the details here).
In this post we can see how after this and taking advantage of increasing the CPU and GPU frequencies, we can really start to get reasonable framerates in more demanding demos. Even if this is still at low resolutions (for this post all the demos were running at 640×480), it is still great to see this on a Raspberry Pi.
Compute Express Link (CXL) is the next spec of significance for connecting hardware devices. It will replace or supplement existing stalwarts like PCIe. The adoption is starting in the datacenter, and the specification definitely provides interesting possibilities for client and embedded devices. A few years ago, the picture wasn't so clear. The original release of the CXL specification wasn't Earth shattering. There were competing standards with intent hardware vendors behind them. The drive to, and release of, the Compute Express Link 2.0 specification changed much of that.
There are a bunch of really great materials hosted by the CXL consortium. I find that these are primarily geared toward use cases, hardware vendors, and sales & marketing. This blog series will dissect CXL with the scalpel of a software engineer. I intend to provide an in depth overview of the driver architecture, and go over how the development was done before there was hardware. This post will go over the important parts of the specification as I see them.
All spec references are relative to the 2.0 specification which can be obtained here.
Let's start with two practical examples.
CXL defines 3 protocols that work on top of PCIe that enable (Chapter 3 of the CXL 2.0 specification) a general purpose way to implement the examples. Two of these protocols help address our 'coherent but fast' problem above. I'll call them the data protocols. The third, CXL.io can be thought of as a stricter set of requirements over PCIe config cycles. I'll call that the enumeration/configuration protocol. We'll not discuss that in any depth as it's not particularly interesting.
There's plenty of great overviews such as this one. The point of this blog is to focus on the specific aspects driver writers and reviewers might care about.
But first, a bit on PCIe coherency. Modern x86 architectures have cache coherent PCIe DMA. For DMA reads this simply means that the DMA engine obtains the most recent copy of the data by requesting it from the fabric. For writes, once the DMA is complete the DMA engine will send an invalidation request to the host(s) to invalidate the range that was DMA'd. Fundamentally however, using this is generally not optimal since keeping coherency would require the CPU basically snoop the PCIe interconnect all the time. This would be bad for power and performance. As such, general drivers manage coherency via software mechanisms. There are exceptions to this rule, but I'm not intimately familiar with them, so I won't add more detail.
 Driving a PCIe NIC
CXL.cache is interesting because it allows the device to participate in the CPU cache coherency protocol as if it were another CPU rather than being a device. From a software perspective, it's the less interesting of the two data protocols. Chapter 3.2.x has a lot of words around what this protocol is for, and how it is designed to work. This protocol is targeted towards accelerators which do not have anything to provide to the system in terms of resources, but instead utilize host-attached memory and a local cache. The CXL.cache protocol if successfully negotiated throughout the CXL topology, host to endpoint, should just work. It permits the device to have coherent view of memory without software intervention and on x86, without the potential negative ramifications of the snoops. Similarly, the host is able to read from the device caches without using main memory as a stopping point. Main memory can be skipped and instead data can be directly transferred over CXL.cache protocol. The protocol describes snoop filtering and the necessary messages to keep coherency. As a software person, I consider it a more efficient version of PCIe coherency, and one which transcends x86 specificity.
CXL.cache has a bidirectional request/response protocol where a request can be made from host to device (H2D) or vice-versa (D2H). The set of commands are what you'd expect to provide proper snooping. For example, H2D requests with one of the 3 Snp* opcodes defined in 3.2.4.3.X, these allow to gain exclusive access to a line, shared access, or just get the current value; while the device uses one of several commands in Table 18 to read/write/invalidate/flush (similar uses).
One might also notice that the peer to peer case isn't covered. The CXL model however makes every device/CPU a peer in the CXL.cache domain. While the current CXL specification doesn't address skipping CPU caches in this matter entirely, it'd be a safe bet to assume a specification so comprehensive would be getting there soon. CXL would allow this more generically than NVMe.
To summarize, CXL.cache essentially lets CPU and device caches to remain coherent without needing to use main memory as the synchronization barrier.
If CXL.cache is for devices that don't provide resources, CXL.mem is exactly the opposite. CXL.mem allows the CPU to have coherent byte addressable access to device-attached memory while maintaining its own internal cache. Unlike CXL.cache where every entity is a peer, the device or host sends requests and responses, the CPU, known as the "master" in the CXL spec, is responsible for sending requests, and the CXL subordinate (device) sends the response. Introduced in CXL 1.1, CXL.mem was added for Type 2 devices. Requests from the master to the subordinate are "M2S" and responses are "S2M".
When CXL.cache isn't also present, CXL.mem is very straightforward. All requests boil down to a read, or a write. When CXL.cache is present, the situation is more tricky. For performance improvements, the host will tell the subordinate about certain ranges of memory which may not need to handle coherency between the device cache, device-attached memory, and the host cache. There is also meta data passed along to inform the device about the current cacheline state. Both the master and subordinate need to keep their cache state in harmony.
CXL.mem protocol is straight forward, especially when the device doesn't also use CXL.cache (ie. it has no local cache).
The requests are known as
The responses:
Unsurprisingly, strict coherency often negatively impacts bandwidth, or latency, or both. While it's generally ideal from a software model to be coherent, it likely won't be ideal for performance. The CXL specification has a solution for this. Chapter 2.2.1 describes a knob which allows a mechanism to provide the hint over which entity should pay for that coherency (CPU vs. device). For many HPC workloads, such as weather modeling, large sets of data are uploaded to an accelerator's device-attached memory via the CPU, then the accelerator crunches numbers on the data, and finally the CPU download results. In CXL, at all times, the model data is coherent for both the device and the CPU. Depending on the bias however, one or the other will take a performance hit.
Using the weather modeling example, there are 4 interesting flows.
*#3 above poses an interesting situation that was possible only with bespoke hardware. The GPU could in theory write that data out via CXL.cache and short-circuit another bias change. In practice though, many such usages would blow out the cache.
The CPU coherency engine has been a thing for a long time. One might ask, why not just use that and be done with it. Well, easy one first, a Device Coherency Engine (DCOH) was already required for CXL.cache protocol support. More practically however, the hit to latency and bandwidth is significant if every cacheline access required a check-in with the CPU's coherency engine. What this means is that when the device wishes to access data from this line, it must first determine the cacheline state (DCOH can track this), if that line isn't exclusive to the accelerator, the accelerator needs to use CXL.cache protocol to request the CPU make things coherent, and once complete, then can access it's device-attached memory. Why is that? If you recall, CXL.cache is essentially where the device is the initiator of the request, and CXL.mem is where the CPU is the initiator.
So suppose we continue on this CPU owns coherency adventure. #1 looks great, the CPU can quickly upload the dataset. However, #2 will immediately hit the bottleneck just mentioned. Similarly for #3, even though a flush won't have to occur, the accelerator will still need to send a request to the CPU to make sure the line gets invalidated. To sum up, we have coherency, but half of our operations are slower than they need to be.
To address this, a [fairly vague] description of bias controls is defined. When in host bias mode, the CPU coherency engine effectively owns the cacheline state (the contents are shared of course) by requiring the device to use CXL.cache for coherency. In device bias mode however, the host will use CXL.mem commands to ensure coherency. This is why Type 2 devices need both CXL.cache and CXL.mem.
I'd like to know why they didn't start numbering at 0. I've already talked quite a bit about device types. I believe it made sense to define the protocols first though so that device types would make more sense. CXL 1.1 introduced two device types, and CXL 2.0 added a third. All types implement CXL.io, the less than exciting protocol we ignore.
| Type | CXL.cache | CXL.mem |
|---|---|---|
| 1 | y | n |
| 2 | y | y |
| 3 | n | y |
Just from looking at the table it'd be wise to ask, if Type 2 does both protocols, why do Type 1 and Type 3 devices exist. In short, gate savings can be had with Type 1 devices not needing CXL.mem, and Type 3 devices offer gate savings and increased performance because they don't have to manage internal cache coherency. More on this next...
These are your accelerators without local memory.
The quintessential Type 1 device is the NIC. A NIC pushes data from memory out onto the wire, or pulls from the wire and into memory. It might perform many steps, such as repackaging a packet, or encryption, or reordering packets (I dunno, not a networking person). Our NAT example above is one such case.
How you might envision that working is the PCIe device would write the incoming packet into the Rx buffer. The CPU would copy that packet out of the Rx buffer, update the IP and port, then write it into the Tx buffer. This set of steps would use memory write bandwidth when the device wrote into the Rx buffer, memory read bandwidth when the CPU copied the packet, and memory write bandwidth when the CPU writes into the Tx buffer. Again, NVMe has a concept to support a subset of this case for peer to peer DMA called Controller Memory Buffers (CMB), but this is limited to NVMe based devices, and doesn't help with coherency on the CPU. Summarizing, (D is device cache, M is memory, H is Host/CPU cache)
Post-CXL this becomes a matter of managing cache ownership throughout the pipeline. The NIC would write the incoming packet into the Rx buffer. The CPU would likely copy it out so as to prevent blocking future packets from coming in. Once done, the CPU has the buffer in its cache. The packet information could be mutated all in the cache, and then delivered to the Tx queue for sending out. Since the NIC may decide to mutate the packet further before going out, it'd issue the RdOwn opcode (3.2.4.1.7), from which point it would effectively own that cacheline.
With accelerators that don't have the possibility of causing backpressure like the Rx queue does, step 2 could be removed.
These are your accelerators with local memory.
Type 2 devices are mandated to support both data protocols and as such, must implement their own DCOH engine (this will vary in complexity based on the underlying device's cache hierarchy complexity). One can think of this problem the same way as multiple CPUs where each has their own L1/L2, but a shared L3 (like Intel CPUs have, where L3 is LLC). Each CPU would need to track transitions between the local L1 and L2, and the L3 to the global L3. TL;DR on this is, for Type 2 devices, there's a relatively complex flow to manage local cache state on the device in relation to the host-attached memory they are using.
In a pre-CXL world, if a device wants to access its own memory, caches or no, it would have the logic to do so. For example, in GPUs, the sampler generally has a cache. If you try to access texture data via the sampler that is already in the sampler cache, everything remains internal to the device. Similarly, if the CPU wishes to modify the texture, an explicit command to invalidate the GPUs sampler cache must be issued before it can be reliably used by the GPU (or flushed if your GPU was modifying the texture).
Continuing with this example in the post-CXL world, the texture lives in graphics memory on the card, and that graphics memory is participating in CXL.mem protocol. That would imply that should the CPU want to inspect, or worse, modify the texture it can do so in a coherent fashion. Later in Type 3 devices, we'll figure out how none of this needs to be that complex for memory expanders.
These are your memory modules. They provide memory capacity that's persistent, volatile, or a combination.
Even though a Type 2 device could technically behave as a memory expander, it's not ideal to do so. The nature of a Type 2 device is that it has a cache which also needs to be maintained. Even with meticulous use of bias controls, extra invalidations and flushes will need to occur, and of course, extra gates are needed to handle this logic. The host CPU does not know a Type 2 device has no cache. To address this, the CXL 2.0 specification introduces a new type, Type 3, which is a "dumb" memory expander device. Since this device has no visible caches (because there is no accelerator), a reduced set of CXL.mem protocol can be used, the CPU will never need to snoop the device, which means the CPU's cache is the cache of truth. What this also implies is a CXL type 3 device simply provides device-attached memory to the system for any use. Hotplug is permitted. Type 3 peer to peer is absent from the 2.0 spec, and unlike CXL.cache, it's not as clear to see the path forward because CXL.mem is a Master/Subordinate protocol.
In a pre-CXL world the closest thing you find to this are a combination of PCIe based NVMe devices (for persistent capacity), NVDIMM devices, and of course, attached DRAM. Generally, DRAM isn't available as expansion cards because a single DDR4 DIMM (which is internally dual channel), only has 21.6 GB/s of bandwidth. PCIe can keep up with that, but it requires all 16 lanes, which I guess isn't scalable, or cost effective, or something. But mostly, it's not a good use of DRAM when the platform based interleaving can yield bandwidth in the hundreds of gigabytes per second.
| Type | Max bandwidth (GB/s) |
|---|---|
| PCIe 4.0 x16 | 32 |
| PCIe 5.0 x16 | 64 |
| PCIe 6.0 x16 | 256 |
| DDR4 (1 DIMM) | 25.6 |
| DDR5 (1 DIMM) | 51.2 |
| HBM3 | 819 |
In a post-CXL world the story is changed in the sense that the OS is responsible for much of the configuration and this is why Type 3 devices are the most interesting from a software perspective. Even though CXL currently runs on PCIe 5.0, CXL offers the ability to interleave across multiple devices thus increasing the bandwidth in multiples by count of the interleave ways. When you take PCIe 6.0 bandwidth, and interleaving, CXL offers quite a robust alternative to HBM, and can even scale to GPU level memory bandwidth with DDR.
 Memory types
This would apply to Type 3 devices, but technically could also apply to Type 2 devices.
Even though the protocols and use-cases should be understood, the devil is in the details with software enabling. Type 1 and Type 2 devices will largely gain benefit just from hardware; perhaps some flows might need driver changes, ie. reducing flushes and/or copies which wouldn't be needed. Type 3 devices on the other hand are a whole new ball of wax.
Type 3 devices will need host physical address space allocated dynamically (it's not entirely unlike memory hot plug, but it is trickier in some ways). The devices will need to be programmed to accept those addresses. And last but not least, those devices will need to be maintained using a spec defined mailbox interface.
The next chapter will start in the same way the driver did, the mailbox interface used for device information and configuration.
Important takeaways are as follow:
The software Vulkan renderer in Mesa, lavapipe, achieved official Vulkan 1.2 conformance. The non obvious entry in the table is here.
Thanks to all the Mesa team who helped achieve this, Shout outs to Mike of Zink fame who drove a bunch of pieces over the line, Roland who helped review some of the funkier changes.
We will be submitting 1.3 conformance soon, just a few things to iron out.
This year I had a goal: to improve my abilities as a kernel developer. After some research, I figured out about the Google Summer of Code (GSoC) initiative.
Last year, I had contact with Isabella Basso during the LKCAMP Hackathon and she told me that she was being mentored by Rodrigo Siqueira. So, in my early 22’, I tried to get in touch with him. He introduced me to this great group of women that were building a project for GSoC.
So, since January, I, Isabella Basso and Magali Lemes were building a project proposal for GSoC to the X.Org Foundation.
Essentially, we had the idea to introduce unit testing to the Display Mode Library (DML) of the AMDGPU driver with KUnit.
So, we divide the DML between us and also welcomed Tales Almeida to the project. Each of us submitted a project proposal to the X.Org Foundation and I proposed a project to Introduce Unit Testing to the Display Mode VBA Library.
Gladly, on May 20th, I received an e-mail congratulating me from GSoC. I got extremely excited that I’ll spend the summer working on something that I love. Moreover, I got extremely happy that Isabella and Tales were approved with me.
I am thrilled to be part of this project and I am super excited for the summer of ‘22. I’m looking forward to work on what I most love.
So, let me talk a bit more about my project.
The modern AMD Linux kernel graphics driver is the single largest driver in the mainline Linux codebase. As AMD releases new GPU models, the size of AMDGPU drivers is only becoming even larger.
At Linux 5.18, the modern AMD driver is approaching 4 million lines of code, which is more than 10% of the entire Linux kernel codebase.
With such a huge codebase, assuring the quality and the reliability of the drivers becomes a hard task without systematic testing, especially for graphic drivers - which usually involve tons of complex calculations. Also, finding bugs becomes an increasingly hard task.
Moreover, a large codebase usually indicates the need for code refactoring. But, refactoring a large codebase without any implemented tests will probably generate tons of bugs, as there is no quality measurement.
In that sense, it is possible to argue for the benefits of implementing unit testing at the AMDGPU drivers. This implementation will help developers to recognize bugs before they are merged into the mainline and also makes it possible for future code refactors of the AMDGPU driver.
When analyzing the AMDGPU driver, a particular part of the driver highlights itself as a good candidate for the implementation of unit tests: the Display Mode Library (DML). DML is fundamental to the functioning of AMD Display Core Next (DCN) since DML calculates the signals - VSTARTUP, VUPDATE, and VREADY - used for Global Sync. DML calculates the signals based on a large number of parameters and ensures our hardware is able to feed the DCN pipeline without underflows or hangs in any given system configuration.
The general project’s idea is to implement unit testing in the Display Mode Library (DML) with the help of the KUnit Framework. Nonetheless, implementing unit testing on all DML functions seems not viable for a 12-week project. That said, my project intends to focus on the Display Mode VBA libraries, especially the dml/display_mode_vba.h and dml/dcn20/display_mode_vba_20.h libraries.
In my project, I intend to create unit tests for all functions at the dml/display_mode_vba.h library because those functions are used in all DCN models VBA libraries. Moreover, considering I have access to the AMDGPU Radeon™ RX 5700 XT, I also intend to create unit tests for the functions at the dml/dcn20/display_mode_vba_20.h library.
The static functions at the libraries won’t be tested, because the main intention is to test the public API of the Display Mode VBA library.
The Display Mode VBA libraries have a very intricate codebase, so I hope that the implementation of unit tests with KUnit and the possible integration with IGT inspire developers to work on a code refactor.
I have already got my hands on the Community Bonding Period, primarily, working on some workflow issues. I use kworkflow to ease my development workflow, but kw doesn’t deploy for Fedora-based systems yet. As a Fedora user (and huge fan), I couldn´t leave that as it is and work on an Arch system. So, I’m currently working on the deployment for Fedora systems.
Also, I’m taking time to get familiar with the mailing lists and to read the AMDGPU documentation. Melissa recommended some great links and I’m willing to read them in the next couple of days.
Moreover, I’m organizing my daily life for this new exciting period. I’m excited to start working and developing on this great community.
Hi all! This month’s status update will be shorter than usual, because I’ve taken some time off to visit Napoli. Discovering the city and the surrounding region was great! Of course the main reason to visit is to taste true Neapolitan pizza. I must admit, this wasn’t a let-down. Should you also be interested in pizza, I found some time to put together a tiny NPotM which displays a map of Neapolitan pizzerias. The source is on sr.ht.

But that’s enough of that, let’s get down to business. This month Conrad Hoffmann has been submitting a lot of patches for go-webdav. The end goal is to build a brand new CardDAV/CalDAV server, tokidoki. Conrad has upstreamed a CalDAV server implementation and a lot of other improvements (mostly to server code, but a few changes also benefit the client implementation). While tokidoki is missing a bunch of features, it’s already pretty usable!
I’ve released a new version of the goguma mobile IRC client yesterday. A network details page has been added, delthas has implemented typing indicators (disabled by default), and a whole lot of reliability improvements have been pushed. I’ve continued polishing my work-in-progress branch with push notifications support, hopefully we’ll be able to merge this soon.
I’ve started working on the gyosu C documentation generator again, and it’s shaping up pretty well. I’ve published an example of rendered docs for wlroots. gyosu will now generate one doc page per header file, and correctly link between these pages. Next I’ll focus on retaining comments inside structs/enums and grouping functions per type.
Pekka, Sebastian and I have finally came to a consensus regarding the libdisplay-info API. The basic API has been merged alongside the testing infrastructure, and we’ll incrementally add new features on top. Because EDID is such a beautiful format, there are still a lot of surprising API decisions that we need to make.
In other FOSS graphics news, I’ve updated drmdb with a new page to list devices supporting a KMS property (example: alpha property), and I’ve improved the filtering UI a bit. I’ve automated the Wayland docs deployment on GitLab, and I’ve planned a new release.
That’s it for now, see you next month!


