
An official website of the United States government
An official website of the United States government
The .gov means it's official.
Federal government websites often end in .gov or .mil. Before sharing sensitive information,
make sure you're on a federal government site.
The site is secure.
The
https:// ensures that you are connecting to the official website and that any
information you provide is encrypted and transmitted securely.
The Current Employment Statistics (CES) program produces detailed industry estimates of nonfarm employment, hours, and earnings of workers on payrolls. CES National Estimates produces data for the nation, and CES State and Metro Area produces estimates for all 50 States, the District of Columbia, Puerto Rico, the Virgin Islands, and about 450 metropolitan areas and divisions.
Each month, CES surveys approximately 122,000 businesses and government agencies, representing approximately 666,000 individual worksites.
- 1-month
- 3-month
- 6-month
- 12-month
Employment change by industry with confidence intervals, March 2023, seasonally adjusted, in thousands
Industry
1-month net change
1-month 90-percent confidence interval
3-month net change
3-month 90-percent confidence interval
6-month net change
6-month 90-percent confidence interval
12-month net change
12-month 90-percent confidence interval
Total nonfarm
236
131.5
1,034
207.3
1,887
285.4
4,145
377.5
Total private
189
122.7
808
193.5
1,567
263.1
3,661
346.7
Goods-producing
-7
38.5
45
59.4
179
81.7
509
118.8
Service providing
243
124.2
989
198.7
1,708
272.9
3,636
358.6
Mining and logging
3
5.5
7
13.3
22
22.5
46
30.1
Construction
-9
24.6
29
39.8
91
55.3
196
76.4
Manufacturing
-1
27.2
9
40.1
66
55.4
267
85.6
Wholesale trade
6.7
16.2
26.5
31.9
51.5
42.6
137.4
53.3
Retail trade
-14.6
24.6
49.0
38.7
24.5
64.9
-15.2
85.5
Transportation and warehousing
10.4
18.2
21.6
28.5
4.7
45.0
137.8
60.8
Utilities
1.5
2.7
-1.3
6.0
-1.6
9.3
2.3
15.6
Information
6
21.7
-27
56.0
-20
80.7
75
99.8
Financial activities
-1
17.6
-3
28.7
30
46.9
101
64.1
Professional and business services
39
57.3
138
88.8
197
116.4
513
154.6
Private education and health services
65
48.2
261
73.1
512
95.0
1,038
126.1
Leisure and hospitality
72
62.1
261
94.5
503
134.1
987
179.9
Other services
11
23.9
37
35.2
87
51.0
175
64.0
Government
47
47.2
226
74.2
320
110.5
484
149.4
Note: Significant changes are calculated at a 90-percent confidence level. The variance for total nonfarm is an approximation because government and rail transportation are not based on a probability sample
04/07/2023
Total nonfarm payroll employment rose by 236,000 in March, and the unemployment rate
changed little at 3.5 percent. Employment continued to trend up in leisure and
hospitality, government, professional and business services, and health care.
HTML
|
PDF
|
RSS
|
Charts
03/14/2023
Real average hourly earnings for all employees decreased 0.1 percent in February, seasonally adjusted. Average hourly earnings increased 0.2 percent, and CPI-U increased 0.4 percent. Real average weekly earnings decreased 0.4 percent.
HTML
|
PDF
|
RSS
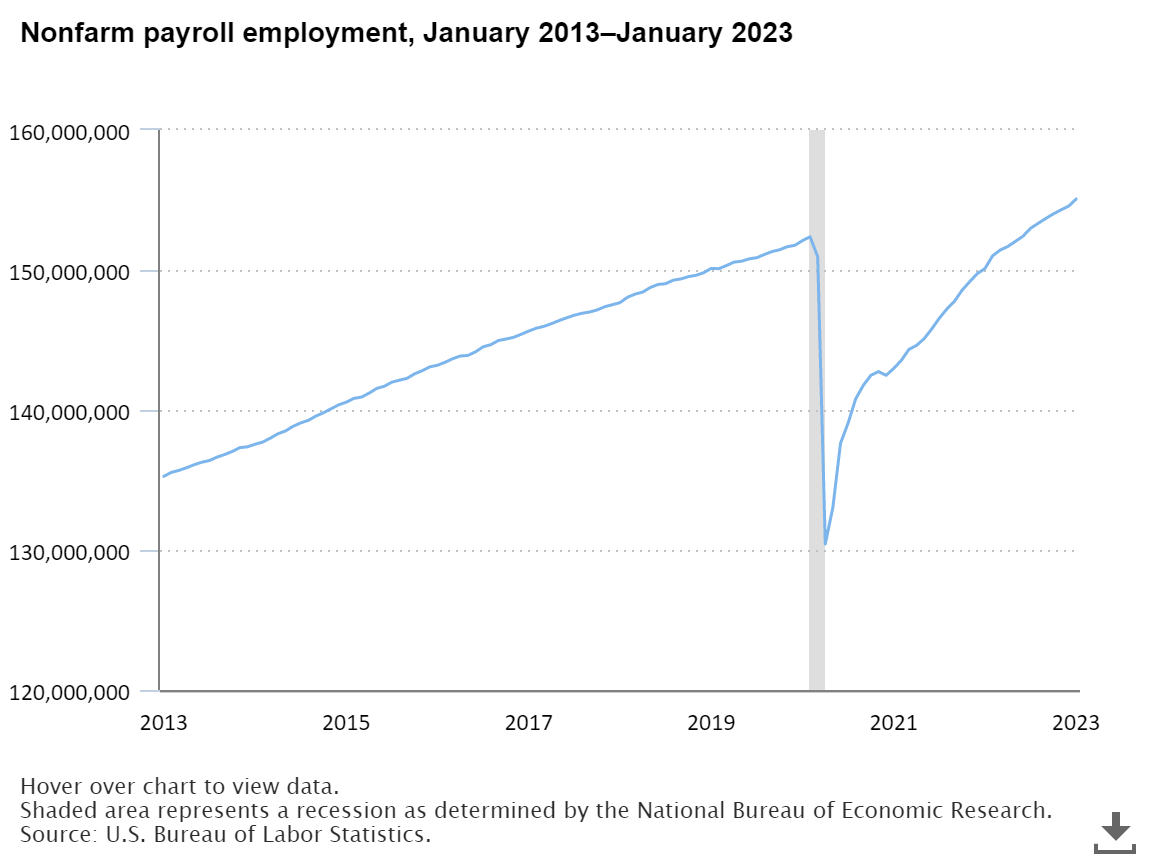
Nonfarm payroll employment rose by 517,000 in January 2023. Job growth was widespread in January, led by gains in leisure and hospitality (+128,000), professional and business services (+82,000), and health care (+58,000). Employment also increased in government, partially reflecting the return of university workers from a strike. read more »

Total nonfarm employment in the United States continued to recover in 2021, with some industries fully recovering and subsequently expanding amid the coronavirus disease 2019 pandemic. read more »

Every 10 years, the U.S. Census Bureau conducts a full count of the entire population of the United States, as mandated by the U.S. Constitution. To achieve this mission, the Census Bureau hires hundreds of thousands of temporary workers. These workers are reflected in the Current Employment Statistics (CES) survey employment estimates. read more »
Change in Total Nonfarm Payroll Employment:
+236,000(p) in Mar 2023
![]()
Change in Total Private Average Hourly Earnings for All Employees:
+$0.09(p) in Mar 2023
![]()
Change in Total Private Average Weekly Hours for All Employees:
-0.1(p) in Mar 2023
![]()
Percent change in Total Private Aggregate Weekly Hours for All Employees:
-0.1%(p) in Mar 2023
![]()
Change in Manufacturing Average Weekly Hours for All Employees:
unchanged in Mar 2023
![]()
Change in Manufacturing Average Weekly Overtime for All Employees:
unchanged in Mar 2023
![]()
Change in Total Private Real Average Hourly Earnings for All Employees:
-$0.02(p) in Feb 2023
![]()