
An official website of the United States government
An official website of the United States government
The .gov means it's official.
Federal government websites often end in .gov or .mil. Before sharing sensitive information,
make sure you're on a federal government site.
The site is secure.
The
https:// ensures that you are connecting to the official website and that any
information you provide is encrypted and transmitted securely.
The Current Employment Statistics (CES) program produces detailed industry estimates of nonfarm employment, hours, and earnings of workers on payrolls. CES National Estimates produces data for the nation, and CES State and Metro Area produces estimates for all 50 States, the District of Columbia, Puerto Rico, the Virgin Islands, and about 450 metropolitan areas and divisions.
Each month, CES surveys approximately 131,000 businesses and government agencies, representing approximately 670,000 individual worksites.
- 1-month
- 3-month
- 6-month
- 12-month
Employment change by industry with confidence intervals, December 2022, seasonally adjusted, in thousands
Industry
1-month net change
1-month 90-percent confidence interval
3-month net change
3-month 90-percent confidence interval
6-month net change
6-month 90-percent confidence interval
12-month net change
12-month 90-percent confidence interval
Total nonfarm
223
116.1
742
187.3
1,840
259.9
4,503
339.9
Total private
220
109.7
641
177.1
1,577
243.8
4,203
317.1
Goods-producing
40
34.1
116
51.7
265
72.5
664
107.6
Service providing
183
110.0
626
180.0
1,575
248.7
3,839
322.6
Mining and logging
4
5.0
10
10.2
16
17.5
54
27.4
Construction
28
22.4
56
36.4
109
52.0
231
71.4
Manufacturing
8
23.2
50
34.4
140
46.9
379
75.7
Wholesale trade
12.1
14.8
22.0
35.5
59.4
45.7
175.7
56.7
Retail trade
9.0
22.1
-10.1
35.3
5.6
60.7
194.4
78.6
Transportation and warehousing
4.7
15.4
-24.5
24.4
-26.7
39.3
207.2
54.8
Utilities
1.6
2.2
1.9
4.8
4.4
8.3
6.3
10.5
Information
-5
19.4
21
57.7
52
87.1
148
105.8
Financial activities
5
15.3
27
24.1
46
39.8
134
57.8
Professional and business services
-6
47.6
-1
75.2
137
98.7
605
137.3
Education and health services
78
46.5
245
66.8
531
79.3
950
110.8
Leisure and hospitality
67
55.1
196
88.6
409
127.7
946
160.3
Other services
14
22.9
48
33.6
95
47.9
173
61.0
Government
3
38.2
101
60.8
263
90.1
300
122.3
Note: Significant changes are calculated at a 90-percent confidence level. The variance for total nonfarm is an approximation because government and rail transportation are not based on a probability sample
01/06/2023
Total nonfarm payroll employment increased by 223,000 in December, and the unemployment rate
edged down to 3.5 percent. Notable job gains occurred in leisure and hospitality, health
care, construction, and social assistance.
HTML
|
PDF
|
RSS
|
Charts
|
Commissioner's Statement
01/12/2023
Real average hourly earnings for all employees increased 0.4 percent in December, seasonally adjusted. Average hourly earnings increased 0.3 percent, and CPI-U decreased 0.1 percent. Real average weekly earnings increased 0.1 percent.
HTML
|
PDF
|
RSS
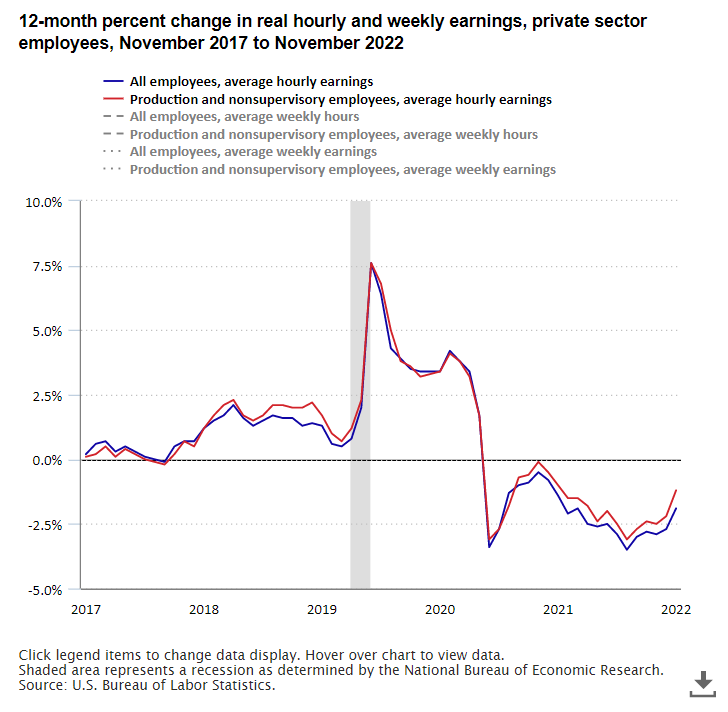
Real average hourly earnings for all employees decreased 1.9 percent from November 2021 to November 2022. The change in real average hourly earnings combined with a decrease of 1.1 percent in the average workweek resulted in a 3.0-percent decrease in real average weekly earnings over this period. read more »

Total nonfarm employment in the United States continued to recover in 2021, with some industries fully recovering and subsequently expanding amid the coronavirus disease 2019 pandemic. read more »

Every 10 years, the U.S. Census Bureau conducts a full count of the entire population of the United States, as mandated by the U.S. Constitution. To achieve this mission, the Census Bureau hires hundreds of thousands of temporary workers. These workers are reflected in the Current Employment Statistics (CES) survey employment estimates. read more »
Change in Total Nonfarm Payroll Employment:
+223,000(p) in Dec 2022
![]()
Change in Total Private Average Hourly Earnings for All Employees:
+$0.09(p) in Dec 2022
![]()
Change in Total Private Average Weekly Hours for All Employees:
-0.1(p) in Dec 2022
![]()
Percent change in Total Private Aggregate Weekly Hours for All Employees:
-0.1%(p) in Dec 2022
![]()
Change in Manufacturing Average Weekly Hours for All Employees:
-0.1(p) in Dec 2022
![]()
Change in Manufacturing Average Weekly Overtime for All Employees:
-0.2(p) in Dec 2022
![]()
Change in Total Private Real Average Hourly Earnings for All Employees:
+$0.04(p) in Dec 2022
![]()