Google Cloud's operations suite (formerly Stackdriver)
Integrated monitoring, logging, and trace managed services for applications and systems running on Google Cloud and beyond.
-
Start using the operations suite with Monitoring and Logging quickstart guides
-
Research shows successful reliability is 4.1 times more likely to incorporate observability
-
Learn how Google Cloud’s operations suite helps customers improve cloud observability
-
Stay up-to-date with the latest blogs and our o11y in-depth video series
-
Download the overview one-pager: Observability in Google Cloud

Key features
Key features
Real-time log management and analysis
Cloud Logging is a fully managed service that performs at scale and can ingest application and platform log data, as well as custom log data from GKE environments, VMs, and other services inside and outside of Google Cloud. Get advanced performance, troubleshooting, security, and business insights with Log Analytics, integrating the power of BigQuery into Cloud Logging.
Built-in metrics observability at scale
Cloud Monitoring provides visibility into the performance, uptime, and overall health of cloud-powered applications. Collect metrics, events, and metadata from Google Cloud services, hosted uptime probes, application instrumentation, and a variety of common application components. Visualize this data on charts and dashboards and create alerts so you are notified when metrics are outside of expected ranges.
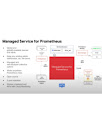
Stand-alone managed service for running and scaling Prometheus
Managed Service for Prometheus is a fully managed Prometheus-compatible monitoring solution, built on top of the same globally scalable data store as Cloud Monitoring. Keep your existing visualization, analysis, and alerting services, as this data can be queried with PromQL or Cloud Monitoring.
Monitor and improve your application's performance
Application Performance Management (APM) combines the monitoring and troubleshooting capabilities of Cloud Logging and Cloud Monitoring with Cloud Trace and Cloud Profiler to help you reduce latency and cost so you can run more efficient applications.
Customers
Learn from customers using operations tools


What's new
What's new
Sign up for Google Cloud newsletters to receive product updates, event information, special offers, and more.


Documentation
Documentation
Operations suite documentation
View all documentation for the operations suite.
Get started with Cloud Monitoring
Learn about metrics scopes, the monitoring agent, uptime checks, and other features.
Get started with Cloud Logging
Guides and set-up docs to help you get up and running with Cloud Logging.
Monitoring and logging support for GKE
Learn about Google Kubernetes Engine’s native integration with Cloud Monitoring and Cloud Logging.
Google Cloud metrics
See which metrics Cloud Monitoring supports.
Hands-on labs: Google Cloud’s operations suite
In this fundamental-level quest, you’ll learn the ins and outs of Google Cloud's operations suite to generate insights into the health of your applications.
Dashboard API: Build your own Cloud Monitoring dashboard
Tips for shareable and reusable dashboard creation.
Cloud Audit Logs
Learn how Cloud Audit Logs maintains three audit logs: admin activity, data access, and system event.
Hybrid and multi-cloud deployments
This document discusses monitoring and logging architectures for hybrid and multi-cloud deployments.
Use cases
Use cases
Cloud Logging and Cloud Monitoring provide your IT Ops/SRE/DevOps teams with out-of-the box observability needed to monitor your infrastructure and applications. Cloud Logging automatically ingests Google Cloud audit and platform logs so that you can get started right away. Cloud Monitoring provides a view of all Google Cloud metrics at zero cost and integrates with a variety of providers for non Google Cloud monitoring.

Reduce Mean Time to Recover (MTTR) and optimize your application’s performance with the full suite of cloud ops tools. Use dashboards to gain insights into your applications with both service and custom application metrics. Use Monitoring SLOs and alerting to help identify errors.
All features
All features
| Log management | Log Router allows customers to control where logs are sent. All logs, including audit logs, platform logs, and user logs, are sent to the Cloud Logging API where they pass through the log router. The log router checks each log entry against existing rules to determine which log entries to discard, which to ingest, and which to include in exports. |
| Proactive monitoring | Cloud Monitoring allows you to create alerting policies to notify you when metrics, health check results, and uptime check results meet specified criteria. Integrated with a wide variety of notification channels, including Slack and PagerDuty. |
| Prometheus as a managed service | Offload the scaling and management of Prometheus infrastructure, updates, storage, and more with Managed Service for Prometheus. Avoid vendor lock-in and keep all of the open source tools you use today for visualization, alerting, and analysis of Prometheus metrics. |
| Custom visualization | Cloud Monitoring provides default out-of-the-box dashboards and allows you to define custom dashboards with powerful visualization tools to suit your needs. |
| Health check monitoring | Cloud Monitoring provides uptime checks to web applications and other internet-accessible services running on your cloud environment. You can configure uptime checks associated with URLs, groups, or resources, such as instances and load balancers. |
| Service monitoring | Service Monitoring provides out-of-the-box telemetry and dashboards that allow troubleshooting in context through topology and context graphs, plus automation of health monitoring through SLOs and error budget management. |
| Latency management | Cloud Trace provides latency sampling and reporting for App Engine, including per-URL statistics and latency distributions. |
| Performance and cost management | Cloud Profiler provides continuous profiling of resource consumption in your production applications, helping you identify and eliminate potential performance issues. |
| Security management | Cloud Audit Logs provides near real-time user activity visibility across Google Cloud. |
Pricing
Pricing
Google Cloud operations products are priced by volume of
data with free monthly allotments and unlimited access to
Google Cloud platform metrics and audit logs. All features
are available for use, without any additional price
considerations.
| Product | Price |
|---|---|
| Cloud Monitoring | All product features and Google Cloud metrics are included at no additional cost. Monthly pricing starts at $0.2580/ MiB for metrics data after the 150 MiB free allocation per billing account. |
| Cloud Logging | All product features and Google Cloud audit logs are included at no additional cost. Monthly pricing starts at $0.50/ GiB for log data after the 50 GiB free allocation per project. |
Partners
Partners
Get support from a rich and growing ecosystem of technology integrations to expand the IT ops, security, and compliance capabilities available to Google Cloud customers.


BindPlane is a registered trademark of Blue Medora.