
An official website of the United States government
An official website of the United States government
The .gov means it's official.
Federal government websites often end in .gov or .mil. Before sharing sensitive information,
make sure you're on a federal government site.
The site is secure.
The
https:// ensures that you are connecting to the official website and that any
information you provide is encrypted and transmitted securely.

Total factor productivity increased in 15 out of 21 major industries in 2021. The largest increase was in arts, entertainment, and recreation (15.1 percent). This was followed by increases in accommodation and food services (12.4 percent), management of companies (6.2 percent), and information (4.6 percent).
read full article »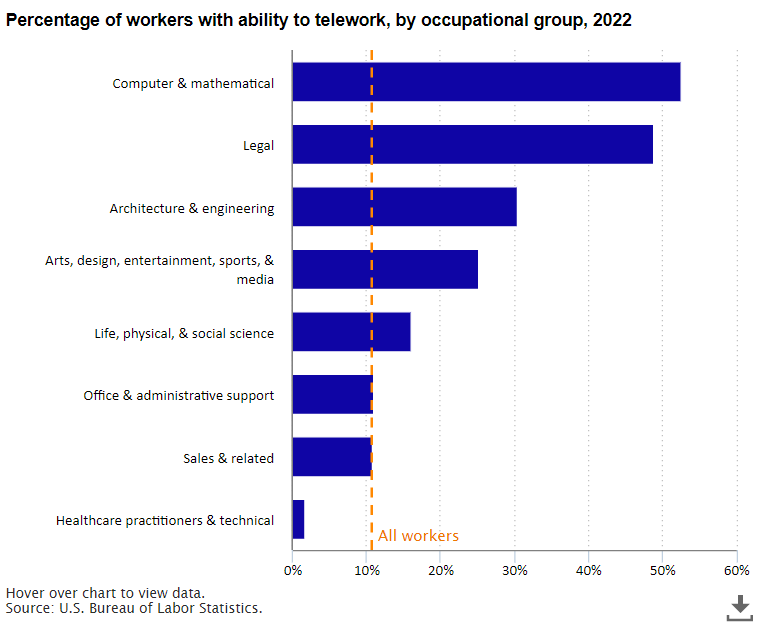
The ability to telework was available to 10.6 percent of civilian workers during 2022. Among occupational groups, the ability to telework ranged from about half of workers in computer and mathematical occupations to less than 2.0 percent of workers in healthcare occupations.

California’s jobless rate decreased 2.1 percentage points over the year ended October 2022. This was the largest decrease for any state over the year. It was followed by New Jersey, where the jobless rate decreased by 2.0 percentage points.
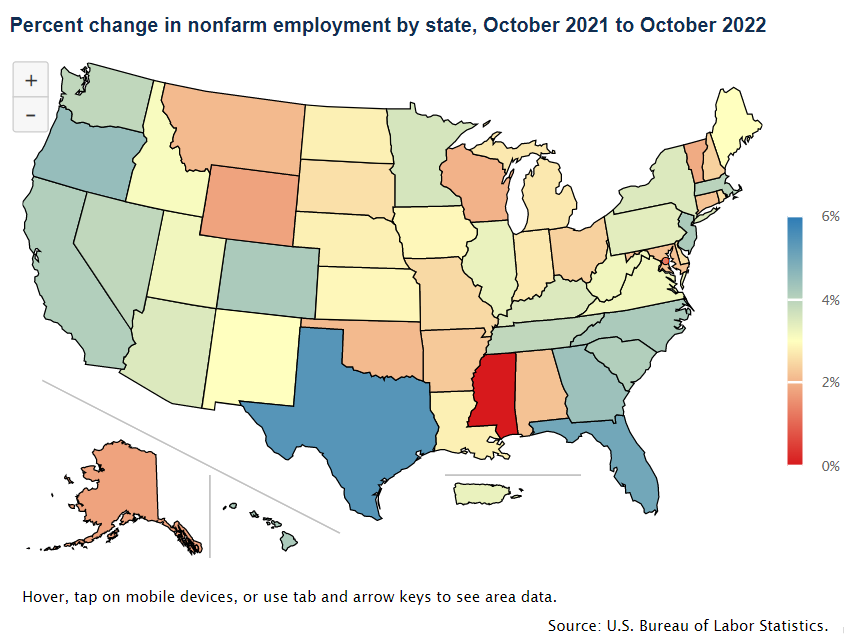
From October 2021 to October 2022, nonfarm payroll employment increased in 46 states and was essentially unchanged in 4 states and the District of Columbia.

There was 0.3 unemployed person per job opening in eight states (Minnesota, Nebraska, New Hampshire, North Dakota, South Dakota, Utah, Vermont, and Virginia) in September 2022.

