The .gov means it's official. Federal government websites often end in .gov or .mil. Before sharing sensitive information,
make sure you're on a federal government site.
The site is secure. The
https:// ensures that you are connecting to the official website and that any
information you provide is encrypted and transmitted securely.
This time of year, it is common to see news stories that track the price of your Thanksgiving dinner. And with the Consumer Price Index (CPI) reaching 40-year highs in recent months, such stories are likely to get some attention. More on current price data below. But first, a look at the BLS archives from 1947. My, have times changed!
We learned from our records from the late 1940s and early 1950s that BLS conducted a special collection of “typical Thanksgiving dinner” prices in selected cities the week before the holiday. A copy of the Washington, DC, area release for 1947 is below.
Some things that stand out:
Apparently only “housewives” handled the Thanksgiving shopping and cooking 75 years ago!
If you add up the numbers in the table, you don’t get the total. Why? The calculation was designed to estimate what a family of four would consume at Thanksgiving dinner, rather than what was actually purchased. So, while the turkey cost 63 cents per pound and, as the text indicates, a 12-pound turkey cost about $7.55, the family of four only consumed 5 pounds at dinner, adding $3.15 to the total cost of the menu. Likewise, they only consumed “1/6 doz” eggs (I think that means 2 eggs), so at 80 cents a dozen, the eggs amounted to 13.3 cents toward the total.
As indicated in the footnotes, estimates of food consumed came from the U.S. Department of Agriculture.
Confused? So was BLS. Among our archives, we found memos suggesting that, while the year-over-year increase was easy to explain, the methodology was not. And at least one senior BLS official got tongue-tied trying to explain the numbers in a radio interview, which ultimately led to the discontinuation of this news release after about 5 years.
More 1940s data
But not before BLS constructed a time series—in the only way we knew how in the 1940s, as the following image illustrates. And in keeping with the best BLS traditions, there was even a revision to the 1946 data. Back then, we went out of our way to get things right, and we do the same today.
Fast forward 75 years
If you want to track the cost of your holiday meal today, you need look no further than the BLS Consumer Price Index. Most of the items listed in the 1947 Thanksgiving release are available in the monthly CPI release, covering all urban consumers. The following chart provides the 12-month percent change for these items in 2022.
Editor’s note: Data for this chart are available in the table below.
The BLS archives are a treasure trove of stories, some that track the economic details of the day, and some that shed light on BLS people and processes. As we uncover more gems, we’ll be sure to share.
12-month percent change in consumer prices for selected food items, October 2022
The U.S. labor market experienced a period of unprecedented volatility during the COVID-19 pandemic. Our monthly survey of nonfarm establishments recorded a decrease in employment of 13.6 percent (20.5 million jobs) between March and April 2020, the largest 1-month drop since the survey began in 1939. The survey then showed an employment gain of 3.4 percent (4.5 million jobs) from May to June 2020, the largest 1-month increase since the survey began. Our monthly survey of U.S. households, the Current Population Survey (CPS), recorded similarly extreme changes in the number of employed Americans for these months.
These statistics are the net result of firms adding and eliminating jobs and workers gaining and losing employment between months. Changes in the employment of individuals are not readily apparent from the headline numbers. Are more people exiting employment, or are fewer entering? To what extent are changes driving firms to hire more workers? To what extent are workers separating from their employers? Let’s look at estimates from two different BLS sources to answer these questions: the Job Opening and Labor Turnover Survey (JOLTS) and research data from the CPS on flows between labor force statuses.
JOLTS samples about 21,000 business establishments to provide monthly data on job openings, hires, and separations. Hires are all additions to payroll during the month, and separations are all employees who separated from payroll for any reason during the month.
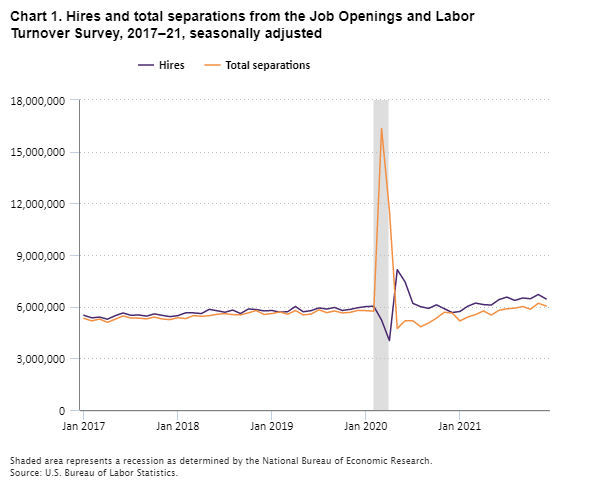
Chart 1 shows JOLTS hires and separations for 2017 to 2021. The initial pandemic-related shock is apparent mostly as an increase in separations, from 5.7 million in February 2020 to 16.3 million in March 2020, a historical high. Hires also decreased, from 6.0 million in February 2020 to 5.2 million in March and 4.0 million in April. But the decrease in hires was a small fraction of the increase in separations. Thus, JOLTS separation data captured the extreme impact of the pandemic in the March 2020 data, like the large movements in our monthly employment surveys.
Editor’s note: Data for this chart are available in the table below.
The mid-2020 rebound in employment reversed this pattern. By May 2020, hires increased to a historical high of 8.1 million, while separations sharply declined to 4.7 million, a 7-year low. Although hires declined from that initial rebound, they were mostly at or above pre-pandemic levels by February 2021 and continued increasing through the rest of the year. Separations also increased, but more slowly, exceeding pre-pandemic levels by mid- to late 2021.
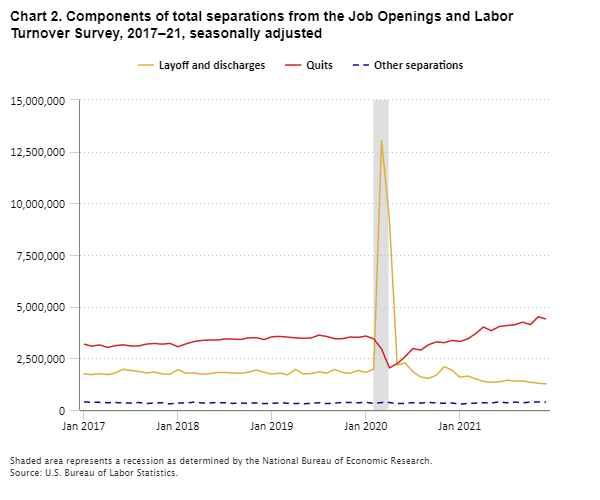
Chart 2 breaks separations into quits, layoffs and discharges, and other separations (retirements, transfers to other locations, deaths, or separations due to employee disability). Both the initial jump in separations and the sharp decline in mid-2020 were mostly because of the changes in the number of layoffs and discharges. However, the increase in separations later in 2020 and into 2021 resulted from increasing quits. Layoffs and discharges continued to decline and reached a low of 1.26 million at the end of 2021. From May 2020 to December 2021 quits trended up, reaching a high of 4.5 million by November 2021.
Editor’s note: Data for this chart are available in the table below.
We might expect higher levels of layoffs and discharges to be associated with larger flows out of employment, as workers who left their jobs involuntarily likely would experience at least brief spells of unemployment or leave the labor force, while workers who quit would be more likely to take jobs at other firms. The decline in layoffs and discharges hints that the number of workers exiting employment was decreasing throughout 2021. However, while JOLTS provides insight into the hiring and separation behavior in firms, it does not directly answer questions regarding the employment status of workers. JOLTS cannot distinguish among newly discharged employees who found another job immediately, searched for jobs, or exited the labor force entirely. Similarly, JOLTS cannot distinguish between newly hired workers who had previously been unemployed and those who had been working at other firms.
To answer these questions, we turn to CPS research data on labor force flows. These data measure the month-to-month movements of people among employment, unemployment, and not in the labor force. For example, we can use these data to see the number of people employed in one month who were unemployed the previous month. Higher levels of hires would be associated with higher flows into employment, as firms hire individuals without a current job as well as workers from other firms.
Chart 3 shows 3-month moving averages of flows into and out of employment from 2017 through 2021. The extreme changes in spring 2020 are readily apparent, with the 3-month average of flows out of employment peaking at 15.0 million in March–May 2020. (The highest single month was 26.9 million in April 2020; we show 3-month averages to better show variation in flows at other dates.) Flows into employment dipped from a pre-pandemic level of about 6.0 million to 5.4 million in February–April 2020 before increasing rapidly in the next few months to peak at 11.5 million in May–July 2020. Both peaks are well above all values since the data began in 1990. Associating hires with flows into employment and layoffs and discharges with flows out of employment, the basic pattern is similar between CPS and JOLTS.
Editor’s note: Data for this chart are available in the table below.
Both flows into and out of employment declined sharply after their peaks. By October–December 2021, flows into employment were still appreciably above pre-pandemic levels at 6.8 million, a similar pattern as JOLTS hires. Flows out of employment were comparable to those 2 years earlier at about 6.1 million. In contrast, JOLTS layoffs and discharges fell below pre-pandemic levels. However, quits increased substantially during 2021, and some of the increase in quits was likely reflected in increased exits from employment even if some quits simply reflected changing jobs. Changes in exits from employment from the reduction in layoffs and discharges and the increase in quits may roughly offset each other.
Overall, both JOLTS and the CPS flows data tell a consistent story. After the unprecedented volatility of the early months of the pandemic, the labor market recovery mostly shows increased hires rather than decreased separations.
Chart 1. Hires and total separations from the Job Openings and Labor Turnover Survey, 2017–21, seasonally adjusted
Month
Hires
Total separations
Jan 2017
5,499,000
5,320,000
Feb 2017
5,350,000
5,176,000
Mar 2017
5,395,000
5,280,000
Apr 2017
5,272,000
5,091,000
May 2017
5,477,000
5,270,000
Jun 2017
5,635,000
5,463,000
Jul 2017
5,497,000
5,338,000
Aug 2017
5,519,000
5,334,000
Sep 2017
5,450,000
5,289,000
Oct 2017
5,581,000
5,397,000
Nov 2017
5,494,000
5,283,000
Dec 2017
5,421,000
5,249,000
Jan 2018
5,480,000
5,358,000
Feb 2018
5,644,000
5,307,000
Mar 2018
5,641,000
5,484,000
Apr 2018
5,599,000
5,439,000
May 2018
5,845,000
5,477,000
Jun 2018
5,763,000
5,559,000
Jul 2018
5,676,000
5,595,000
Aug 2018
5,803,000
5,540,000
Sep 2018
5,601,000
5,522,000
Oct 2018
5,867,000
5,641,000
Nov 2018
5,833,000
5,777,000
Dec 2018
5,754,000
5,546,000
Jan 2019
5,778,000
5,600,000
Feb 2019
5,684,000
5,694,000
Mar 2019
5,706,000
5,558,000
Apr 2019
6,010,000
5,773,000
May 2019
5,704,000
5,523,000
Jun 2019
5,769,000
5,570,000
Jul 2019
5,928,000
5,818,000
Aug 2019
5,862,000
5,653,000
Sep 2019
5,954,000
5,750,000
Oct 2019
5,779,000
5,634,000
Nov 2019
5,845,000
5,670,000
Dec 2019
5,941,000
5,786,000
Jan 2020
6,005,000
5,769,000
Feb 2020
6,025,000
5,738,000
Mar 2020
5,222,000
16,336,000
Apr 2020
4,031,000
11,590,000
May 2020
8,145,000
4,732,000
Jun 2020
7,438,000
5,182,000
Jul 2020
6,188,000
5,179,000
Aug 2020
5,998,000
4,833,000
Sep 2020
5,898,000
5,052,000
Oct 2020
6,105,000
5,331,000
Nov 2020
5,885,000
5,677,000
Dec 2020
5,660,000
5,634,000
Jan 2021
5,719,000
5,172,000
Feb 2021
6,028,000
5,400,000
Mar 2021
6,208,000
5,540,000
Apr 2021
6,121,000
5,753,000
May 2021
6,092,000
5,513,000
Jun 2021
6,414,000
5,793,000
Jul 2021
6,556,000
5,874,000
Aug 2021
6,362,000
5,913,000
Sep 2021
6,504,000
6,008,000
Oct 2021
6,460,000
5,852,000
Nov 2021
6,705,000
6,197,000
Dec 2021
6,450,000
6,042,000
Chart 2. Components of total separations from the Job Openings and Labor Turnover Survey, 2017–21, seasonally adjusted
Month
Layoff and discharges
Quits
Other separations
Jan 2017
1,745,000
3,188,000
387,000
Feb 2017
1,711,000
3,089,000
376,000
Mar 2017
1,762,000
3,150,000
369,000
Apr 2017
1,710,000
3,028,000
353,000
May 2017
1,794,000
3,111,000
364,000
Jun 2017
1,970,000
3,154,000
339,000
Jul 2017
1,910,000
3,097,000
332,000
Aug 2017
1,868,000
3,103,000
362,000
Sep 2017
1,787,000
3,190,000
312,000
Oct 2017
1,837,000
3,219,000
341,000
Nov 2017
1,747,000
3,186,000
349,000
Dec 2017
1,732,000
3,222,000
295,000
Jan 2018
1,953,000
3,060,000
344,000
Feb 2018
1,784,000
3,195,000
329,000
Mar 2018
1,797,000
3,309,000
379,000
Apr 2018
1,734,000
3,364,000
341,000
May 2018
1,754,000
3,384,000
339,000
Jun 2018
1,815,000
3,381,000
363,000
Jul 2018
1,813,000
3,437,000
345,000
Aug 2018
1,790,000
3,431,000
319,000
Sep 2018
1,772,000
3,414,000
337,000
Oct 2018
1,828,000
3,487,000
326,000
Nov 2018
1,933,000
3,502,000
341,000
Dec 2018
1,831,000
3,407,000
308,000
Jan 2019
1,735,000
3,545,000
320,000
Feb 2019
1,789,000
3,558,000
347,000
Mar 2019
1,702,000
3,527,000
329,000
Apr 2019
1,967,000
3,491,000
316,000
May 2019
1,753,000
3,468,000
301,000
Jun 2019
1,762,000
3,486,000
322,000
Jul 2019
1,844,000
3,624,000
350,000
Aug 2019
1,786,000
3,557,000
309,000
Sep 2019
1,961,000
3,452,000
338,000
Oct 2019
1,819,000
3,453,000
362,000
Nov 2019
1,777,000
3,530,000
363,000
Dec 2019
1,919,000
3,516,000
350,000
Jan 2020
1,821,000
3,578,000
370,000
Feb 2020
1,973,000
3,445,000
320,000
Mar 2020
13,026,000
2,951,000
359,000
Apr 2020
9,191,000
2,038,000
361,000
May 2020
2,180,000
2,244,000
308,000
Jun 2020
2,279,000
2,580,000
323,000
Jul 2020
1,850,000
2,973,000
357,000
Aug 2020
1,598,000
2,901,000
333,000
Sep 2020
1,531,000
3,158,000
363,000
Oct 2020
1,687,000
3,297,000
347,000
Nov 2020
2,097,000
3,258,000
321,000
Dec 2020
1,928,000
3,368,000
338,000
Jan 2021
1,582,000
3,311,000
278,000
Feb 2021
1,641,000
3,439,000
319,000
Mar 2021
1,512,000
3,695,000
333,000
Apr 2021
1,384,000
4,015,000
354,000
May 2021
1,343,000
3,838,000
333,000
Jun 2021
1,361,000
4,035,000
397,000
Jul 2021
1,440,000
4,088,000
346,000
Aug 2021
1,404,000
4,126,000
383,000
Sep 2021
1,405,000
4,253,000
349,000
Oct 2021
1,342,000
4,132,000
379,000
Nov 2021
1,295,000
4,510,000
393,000
Dec 2021
1,262,000
4,403,000
377,000
Chart 3. Flows into and out of employment, 2017–21, 3-month moving averages, seasonally adjusted
My thanks to BLS economist Jill Janocha Redmond for her help with this blog.
The history of baseball is all about numbers, and a few baseball numbers—62 and 700—have gotten a lot of attention recently. (Aaron Judge of the Yankees hit a whopping 62 home runs during the 2022 season, and Albert Pujols of the Cardinals passed the milestone of 700 home runs in his career before he retires.) As we settle in to watch the remaining teams vie for the ultimate title, it’s interesting to notice how the emphasis on baseball numbers has changed over time. There are simple numbers, like batting average, with a long history. How many youngsters improved their long division skills by poring over the box scores in the morning paper? But today there are more complex numbers, like on-base plus slugging (OPS), which might require some explaining and some computing skills. Likewise, BLS has both simple and complex numbers, each demonstrating different aspects of economic activity. Let’s look at both.
World Series records
We looked at the record books to check out batting average and OPS for the World Series. The focus here is on single-season records, trying to avoid any bias as some players (and teams) had many World Series appearances, while others had few. Is there a connection between those players with the best World Series batting average and those with the best OPS?
As a reminder, batting average is hits divided by at bats. Major League Baseball describes batting average as “one of the oldest and most universal tools to measure a hitter’s success at the plate.” There are details, such as “at bats” don’t include walks or sacrifices. But let’s try to keep things simple. OPS is the sum of on-base percentage (how frequently a batter reaches base per plate appearance) and slugging percentage (total bases per at bat). As indicated, things get complicated pretty fast. Major League Baseball says OPS “is meant to combine how well a hitter can reach base, and how well he can hit for average and for power.” Take a look at the top 5 in each category.
Editor’s note: Data for this chart are available in the table below.
Editor’s note: Data for this chart are available in the table below.
The first thing you notice is that these numbers go back more than a century, as the long tradition of baseball numbers just grows and grows. Also notice that there is much overlap between the lists; 3 out of 5 players show up on both charts. In each case, a fourth player shows up in the top 10 (Gehrig is number 10 in batting average and Ortiz is number 7 in OPS), while only one player in each category is not in the top 10 (Bonds in batting average and Ledée in OPS). This suggests a substantial relationship between the tried-and-true statistic and the upstart, complex number. Is the same true at BLS?
Productivity statistics
BLS has been providing measures of productivity in the U.S. economy since the end of World War II. Our headline measure looks at labor productivity in the nonfarm business sector. Like a batting average, labor productivity is a simple calculation: output divided by hours worked. It is doubtful that youngsters are practicing their long division on these numbers, and, in fact, the calculation is not quite so simple. There are multiple data sources and multiple adjustments needed to ensure consistency among the components. Nonetheless, labor productivity is the traditional, easier-to-understand measure.
The OPS of productivity statistics is Total Factor Productivity, which we call TFP for short. TFP compares output to the combined inputs of labor and capital. Capital includes things like machinery, buildings, and software. Labor includes hours worked and an adjustment to capture skill of the workers, which we call labor composition. For the math geeks among us, total factor productivity starts with the hours worked from the labor productivity measures and adjusts for changes in capital and labor composition over time.
Much like our baseball statistics, the question is what is the relationship between labor productivity and total factor productivity? Let’s look at some data. They are similar, like our baseball statistics, but have key differences.
Editor’s note: Data for this chart are available in the table below.
Looking at the trend lines for the 2010 decade, there is a clear relationship between labor productivity and TFP. The lines seem identical for a couple of years, and where they diverge, they continue in the same direction. The trends are the same as they are using the same output and base of hours, but then TFP takes that and adjusts hours, and measures a few other things. We would expect TFP to be a lower line because it accounts for more of what’s going into production, and thus the difference between outputs and inputs is going to be less.
Labor productivity and total factor productivity aim to measure how much input it takes to create the output of the economy. In the case of labor productivity, we only look at hours worked compared to output, and the difference (what we didn’t measure) is labor productivity. In total factor productivity, we measure both labor (hours and composition adjustment) and capital. We can show both inputs in terms of how they create the output. If productivity increases, the economy has become more efficient.
To take it a step further, we can express total factor productivity as a part of labor productivity, as seen in the next chart.
Editor’s note: Data for this chart are available in the table below.
Here we see variations over each business cycle dating back 70 years. Over time, capital intensity and labor composition are pretty stable in terms of contributing to labor productivity growth. Innovations and improvements—what we measure with total factor productivity—are the most important determinant in labor productivity growth.
For those who can’t get enough data and want to know more about productivity, be sure to see our productivity page. For more about baseball, try the internet. Like baseball, you can always get more complex—wins above replacement (WAR) anyone? If you start looking at TFP data by industry, it gets even more complex as we measure more inputs. To learn more about that complexity, see my blog on Expanding BLS Data on Total Factor Productivity.
One thing we don’t measure at BLS is the productivity of baseball players. For that, you’ll have to settle in for the Fall Classic. Enjoy!
Top 5 single-season World Series batting averages
Player
Batting average
Billy Hatcher (1990)
0.750
David Ortiz (2013)
0.688
Babe Ruth (1928)
0.625
Hideki Matsui (2009)
0.615
Ricky Ledée (1998)
0.600
Top 5 single-season World Series On-base Plus Slugging (OPS)
Player
OPS
Lou Gehrig (1928)
2.433
Billy Hatcher (1990)
2.050
Hideki Matsui (2009)
2.027
Babe Ruth (1928)
2.022
Barry Bonds (2002)
1.994
Labor and total factor productivity, annualized percent change, private nonfarm business, 2010–19
Year
Labor productivity
Total factor productivity
2010
3.4
2.7
2011
0.0
-0.1
2012
1.0
0.9
2013
0.5
0.1
2014
0.6
0.3
2015
1.2
0.7
2016
0.3
-0.4
2017
1.1
0.4
2018
1.5
0.8
2019
2.1
1.0
Average annual percent changes in sources of labor productivity growth during business cycles from 1948 to 2019, private business sector
At BLS, we are always looking for new ways to produce timely, accurate, and relevant data. In the spring of 2020, it quickly became clear the COVID-19 pandemic was going to have a major impact on the labor market and working conditions in the United States and globally. New surveys require considerable time and resources, but we wanted to produce new, high-quality data about the impact of the pandemic on businesses and workers. We also knew we needed to produce timely data so they would be relevant and useful for policymakers, the business community, students, researchers, and the public.
In early 2020, our Quarterly Census of Employment and Wages program was piloting a platform that could add questions to the end of an existing BLS survey. In March 2020, staff quickly began creating survey questions to ask businesses about how their operations were changing because of the pandemic. Using this platform allowed BLS to leverage existing infrastructure to quickly create and field a new survey, the Business Response Survey to the Coronavirus Pandemic. It also allowed BLS to produce detailed data by state, industry, and business size.
BLS conducted surveys about the business response to the pandemic in 2020 and 2021. From the 2021 survey, 14.5 percent of establishments increased base wages because of the COVID-19 pandemic. Looking at the industry detail, we find that establishments in accommodation and food services, retail trade, health care and social assistance, and manufacturing increased base wages at a higher rate than the average for the nation overall.
Editor’s note: Data for this chart are available in the table below.
From the 2021 survey, we also found that 34.5 percent of establishments increased telework for some or all their employees during the pandemic. Among the industries, we found that accommodation and food services, natural resources and mining, retail trade, and construction were the least likely to increase telework.
Editor’s note: Data for this chart are available in the table below.
Among the establishments that increased telework, 60.2 percent expected to keep the increases permanent after the end of the pandemic. We found that the five states or areas with the highest expectation of continued telework were the District of Columbia (76.7 percent), Illinois (69.3 percent), North Carolina (68.5 percent), Arizona (68.1 percent) and Colorado (68.0 percent).
Editor’s note: Data for this map are available in the table below.
The 2021 survey found that 28 percent of establishments offered some or all employees an incentive to get a COVID-19 vaccination. Incentives could have been financial, paid time off, or permitting employees to remain on the clock to get a COVID-19 vaccination. The five states or areas in which establishments were most likely to offer vaccination incentives were Puerto Rico (49.3 percent), California (39.2 percent), District of Columbia (37.9 percent), Washington (32.8 percent), and Maryland (31.3 percent).
Editor’s note: Data for this map are available in the table below.
BLS produced additional estimates on telework, workplace flexibilities, changes in pay, COVID-19 workplace requirements, establishment space size, relocation, supplementing workforce, automation, drug and alcohol testing, and COVID-19 loans or grants. These estimates are available in the 2021 tables.
This year BLS is fielding another survey, asking businesses about telework, hiring, and vacancies. For telework, we are asking businesses about current telework practices, expectations about the future of telework, and telework practices before the COVID-19 pandemic. We also are asking about the ability to telework full time for new hires and vacancies. For hiring, we are asking about actions businesses have taken to attract more applicants and the length of time it takes to hire new employees with certain requirements such as professional licenses or advanced degrees. For vacancies, we are asking about how firms are advertising positions that require different education levels.
Have a question or idea for the Business Response Survey team? Email us at [email protected].
Percent of establishments that increased base wages (straight-time wages or salary) because of the COVID-19 pandemic, by industry
Industry
Percent of establishments
Total private sector
14.5%
Accommodation and food services
34.3
Retail trade
20.1
Health care and social assistance
19.4
Manufacturing
17.9
Transportation and warehousing
13.8
Educational services
11.8
Arts, entertainment, and recreation
11.5
Construction
11.4
Other services, except public administration
11.3
Natural resources and mining
10.4
Wholesale trade
9.8
Professional and business services
9.7
Information
8.3
Financial activities
7.1
Utilities
4.7
Percent of establishments that increased telework for some or all employees since the start of the COVID-19 pandemic, by industry
Industry
Percent of establishments
Total private sector
34.5%
Educational services
62.7
Information
60.9
Professional and business services
53.1
Financial activities
52.2
Wholesale trade
43.9
Health care and social assistance
38.9
Utilities
38.7
Arts, entertainment, and recreation
33.4
Manufacturing
30.5
Other services, except public administration
25.3
Transportation and warehousing
23.4
Construction
16.8
Retail trade
14.9
Natural resources and mining
12.2
Accommodation and food services
3.6
Percent of establishments with increased telework that expect the increase to continue when the pandemic is over, by state
State
Percent of establishments
Alabama
–
Alaska
60.1
Arizona
68.1
Arkansas
51.9
California
67.4
Colorado
68.0
Connecticut
67.0
Delaware
60.8
District of Columbia
76.7
Florida
59.0
Georgia
56.6
Hawaii
65.0
Idaho
59.0
Illinois
69.3
Indiana
60.2
Iowa
53.6
Kansas
63.3
Kentucky
–
Louisiana
–
Maine
55.8
Maryland
66.4
Massachusetts
59.7
Michigan
56.4
Minnesota
67.2
Mississippi
–
Missouri
64.4
Montana
59.2
Nebraska
54.2
Nevada
55.0
New Hampshire
54.3
New Jersey
–
New Mexico
59.4
New York
52.1
North Carolina
68.5
North Dakota
56.6
Ohio
44.4
Oklahoma
57.3
Oregon
65.2
Pennsylvania
65.2
Rhode Island
64.8
South Carolina
64.7
South Dakota
56.2
Tennessee
56.7
Texas
54.9
Utah
59.4
Vermont
54.4
Virginia
64.7
Washington
63.5
West Virginia
36.4
Wisconsin
51.0
Wyoming
56.4
Puerto Rico
44.4
Percent of establishments that offered any employees a financial incentive, paid time off, or permitted employees to remain on the clock to get a COVID-19 vaccination, by state
I am pleased to announce that BLS is now publishing monthly labor force estimates for Native Hawaiians and Other Pacific Islanders and people who are of Two or More Races. For several years we have published a small set of annual labor market estimates for these populations in our report on labor force characteristics by race and ethnicity. But we have not published monthly estimates of the unemployment rate, the employment–population ratio, the labor force participation rate, and other key metrics for Native Hawaiians and Other Pacific Islanders and people who are of Two or More Races. With the release of the Employment Situation report on September 2, 2022, we now have monthly data for both groups available back to January 2003.
The Native Hawaiian and Other Pacific Islander category is defined as people having origins in any of the original peoples of Hawaii, Guam, Samoa, or other Pacific Islands. Pacific Islanders are diverse populations with different languages and cultures and include Polynesian, Micronesian, and Melanesian. Two or More Races is defined as people who identify as more than one race. Before 2003, people could identify only one race category as their main race in the Current Population Survey, the source of our data on unemployment and the labor force.
The jobless rate for Native Hawaiians and Other Pacific Islanders peaked at 14.6 percent in November 2020, about 9 months into the COVID-19 pandemic. This was double the seasonally adjusted rate of 6.7 percent for the total population. The unemployment rate for people who are of Two or More Races peaked at 19.3 percent in April 2020, early in the pandemic, compared with 14.7 percent for all groups.
The unemployment rate has declined for all groups since their peaks during the COVID-19 pandemic. By August 2022, the overall unemployment rate for the United States was 3.7 percent. The rate was 3.8 percent for Native Hawaiians and Other Pacific Islanders and 6.2 percent for people who are of Two or More Races.
Editor’s note: Data for this chart are available in the table below.
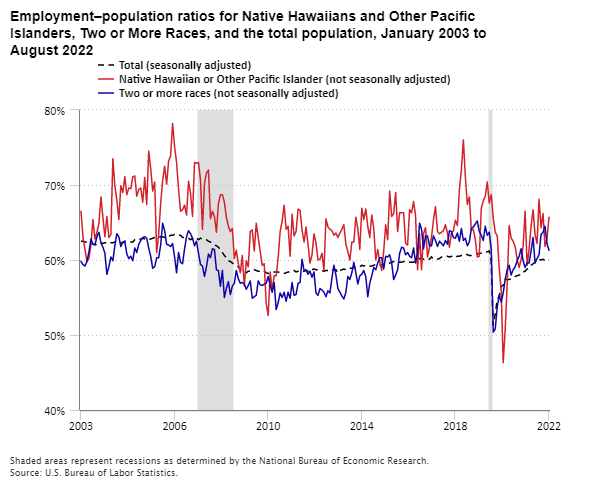
The ratios for all groups declined sharply at the start of the COVID-19 pandemic and have not yet returned to their pre-pandemic levels. In August 2022, the employment–population ratio was 60.1 percent for the United States. The ratio was 65.7 percent for Native Hawaiians and Other Pacific Islanders and 61.3 percent for people who are of Two or More Races.
The employment–population ratio is generally higher for Native Hawaiians and Other Pacific Islanders than the U.S. average. The greater likelihood of employment among Native Hawaiians and Other Pacific Islanders reflects the fact that a larger share of this population is in the 25 to 54 age range than the overall population. People in this age range are more likely to be employed than people in younger and older age groups. By contrast, from 2003 to 2016, the employment–population ratio was generally lower for people who are of Two or More Races than the U.S. average. In recent years, the employment–population ratio for people who are of Two or More Races is little different than the national rate.
Editor’s note: Data for this chart are available in the table below.
Monthly estimates give us timely measures to see how groups are faring in the labor market. However, one must exercise caution when analyzing and interpreting monthly data for small population groups. The measures for Native Hawaiians and Other Pacific Islanders and for people who are of Two or More Races tend to be volatile for two main reasons. First, the estimates are based on small sample sizes. We survey about 60,000 U.S. households every month. People who identify themselves as Native Hawaiians and Other Pacific Islanders make up about 0.5 percent of the total labor force. People who identify as having Two or More Races make up about 2.2 percent of the total labor force. Because of their small sample sizes, the month-to-month change in our key economic metrics must be pretty large to be statistically significant. On average, the unemployment rate for Native Hawaiians and Other Pacific Islanders must change by nearly 4 percentage points and the rate for people who are of Two or More Races must change by around 2 percentage points for the differences to be meaningful.
Second, these data are not seasonally adjusted. Seasonal adjustment is a statistical procedure used to remove the effects of seasonality from data so it is easier to see underlying trends. But not all data series can be seasonally adjusted; they must pass a battery of diagnostic tests to be fitted to a seasonal adjustment model. So far, we haven’t been able to do that for data for Native Hawaiians and Other Pacific Islanders and people who are of Two or More Races, but we’ll keep evaluating them as we get more data. Because these data aren’t seasonally adjusted, it can be challenging to compare one month to the following month.
We’re also publishing quarterly estimates for Native Hawaiians and Other Pacific Islanders and people who are of Two or More Races for the first time starting this month. Because these estimates are averages of three months of data, they are somewhat less volatile.
Unemployment rates for Native Hawaiians and Other Pacific Islanders, Two or More Races, and the total population, January 2003 to August 2022
Month
Total (seasonally adjusted)
Native Hawaiian or Other Pacific Islander (not seasonally adjusted)
Two or more races (not seasonally adjusted)
Jan 2003
5.8%
4.3%
10.1%
Feb 2003
5.9
7.0
9.3
Mar 2003
5.9
6.5
8.8
Apr 2003
6.0
9.0
9.5
May 2003
6.1
7.7
9.3
Jun 2003
6.3
7.2
9.7
Jul 2003
6.2
6.8
9.0
Aug 2003
6.1
6.6
8.6
Sep 2003
6.1
8.6
9.4
Oct 2003
6.0
10.7
8.5
Nov 2003
5.8
10.3
9.1
Dec 2003
5.7
8.7
7.6
Jan 2004
5.7
7.4
8.8
Feb 2004
5.6
5.8
10.6
Mar 2004
5.8
4.2
8.6
Apr 2004
5.6
6.3
8.4
May 2004
5.6
3.7
8.8
Jun 2004
5.6
3.2
8.2
Jul 2004
5.5
5.2
8.0
Aug 2004
5.4
5.5
8.2
Sep 2004
5.4
7.8
9.2
Oct 2004
5.5
7.2
9.2
Nov 2004
5.4
6.5
7.5
Dec 2004
5.4
8.8
8.7
Jan 2005
5.3
3.3
9.0
Feb 2005
5.4
2.5
9.0
Mar 2005
5.2
4.2
9.2
Apr 2005
5.2
4.1
6.6
May 2005
5.1
5.8
7.7
Jun 2005
5.0
3.4
9.2
Jul 2005
5.0
5.4
8.1
Aug 2005
4.9
5.1
7.1
Sep 2005
5.0
5.6
7.6
Oct 2005
5.0
5.5
6.8
Nov 2005
5.0
4.3
8.7
Dec 2005
4.9
3.7
7.0
Jan 2006
4.7
7.6
7.0
Feb 2006
4.8
4.0
7.7
Mar 2006
4.7
5.4
7.8
Apr 2006
4.7
6.3
7.0
May 2006
4.6
7.5
6.0
Jun 2006
4.6
5.7
5.8
Jul 2006
4.7
4.4
6.6
Aug 2006
4.7
6.8
7.1
Sep 2006
4.5
4.9
6.6
Oct 2006
4.4
3.1
6.3
Nov 2006
4.5
5.1
6.1
Dec 2006
4.4
3.4
6.2
Jan 2007
4.6
4.0
7.8
Feb 2007
4.5
5.0
6.8
Mar 2007
4.4
7.3
8.5
Apr 2007
4.5
5.1
7.5
May 2007
4.4
5.5
6.4
Jun 2007
4.6
3.6
5.5
Jul 2007
4.7
6.0
6.9
Aug 2007
4.6
4.7
5.4
Sep 2007
4.7
6.4
7.2
Oct 2007
4.7
3.3
8.0
Nov 2007
4.7
4.6
7.4
Dec 2007
5.0
2.8
8.4
Jan 2008
5.0
4.4
8.6
Feb 2008
4.9
6.1
7.7
Mar 2008
5.1
4.2
9.6
Apr 2008
5.0
3.2
9.9
May 2008
5.4
4.1
9.7
Jun 2008
5.6
6.3
9.3
Jul 2008
5.8
6.1
8.6
Aug 2008
6.1
9.1
8.9
Sep 2008
6.1
9.4
10.5
Oct 2008
6.5
7.1
9.3
Nov 2008
6.8
7.3
11.0
Dec 2008
7.3
8.4
10.3
Jan 2009
7.8
7.4
12.7
Feb 2009
8.3
6.8
12.4
Mar 2009
8.7
13.4
14.7
Apr 2009
9.0
10.5
16.7
May 2009
9.4
8.9
14.7
Jun 2009
9.5
13.9
15.2
Jul 2009
9.5
14.6
11.4
Aug 2009
9.6
12.8
13.3
Sep 2009
9.8
14.4
13.5
Oct 2009
10.0
7.7
12.8
Nov 2009
9.9
10.1
12.5
Dec 2009
9.9
8.7
12.9
Jan 2010
9.8
10.9
14.4
Feb 2010
9.8
9.2
12.4
Mar 2010
9.9
11.3
14.4
Apr 2010
9.9
12.3
14.7
May 2010
9.6
10.6
14.9
Jun 2010
9.4
12.1
14.9
Jul 2010
9.4
12.9
14.9
Aug 2010
9.5
13.1
12.8
Sep 2010
9.5
10.5
12.9
Oct 2010
9.4
15.6
12.8
Nov 2010
9.8
15.1
12.2
Dec 2010
9.3
11.5
12.6
Jan 2011
9.1
11.9
13.1
Feb 2011
9.0
14.3
12.4
Mar 2011
9.0
13.0
14.7
Apr 2011
9.1
14.3
12.0
May 2011
9.0
9.5
12.1
Jun 2011
9.1
8.4
16.7
Jul 2011
9.0
6.7
15.3
Aug 2011
9.0
9.2
15.1
Sep 2011
9.0
9.2
13.8
Oct 2011
8.8
10.2
14.6
Nov 2011
8.6
9.7
11.2
Dec 2011
8.5
9.3
11.4
Jan 2012
8.3
9.3
13.6
Feb 2012
8.3
11.9
12.3
Mar 2012
8.2
10.4
12.2
Apr 2012
8.2
10.7
10.4
May 2012
8.2
14.7
11.2
Jun 2012
8.2
11.9
10.6
Jul 2012
8.2
11.5
12.8
Aug 2012
8.1
15.3
11.8
Sep 2012
7.8
11.8
10.8
Oct 2012
7.8
9.9
11.7
Nov 2012
7.7
9.7
13.6
Dec 2012
7.9
14.5
11.3
Jan 2013
8.0
9.5
12.1
Feb 2013
7.7
9.9
11.8
Mar 2013
7.5
11.8
11.6
Apr 2013
7.6
8.2
10.1
May 2013
7.5
8.5
10.2
Jun 2013
7.5
6.1
14.2
Jul 2013
7.3
10.0
11.3
Aug 2013
7.2
12.4
11.2
Sep 2013
7.2
10.3
9.7
Oct 2013
7.2
12.2
10.4
Nov 2013
6.9
12.1
9.5
Dec 2013
6.7
11.1
9.5
Jan 2014
6.6
9.6
11.2
Feb 2014
6.7
7.0
10.8
Mar 2014
6.7
4.7
9.9
Apr 2014
6.2
5.4
10.2
May 2014
6.3
4.1
9.6
Jun 2014
6.1
6.1
9.8
Jul 2014
6.2
7.3
11.8
Aug 2014
6.1
5.2
11.4
Sep 2014
5.9
5.7
10.8
Oct 2014
5.7
4.3
8.9
Nov 2014
5.8
7.0
9.2
Dec 2014
5.6
6.5
9.1
Jan 2015
5.7
7.9
11.0
Feb 2015
5.5
6.3
9.3
Mar 2015
5.4
2.5
10.1
Apr 2015
5.4
6.0
7.8
May 2015
5.6
5.6
9.6
Jun 2015
5.3
5.5
7.8
Jul 2015
5.2
4.1
8.8
Aug 2015
5.1
5.3
8.1
Sep 2015
5.0
9.1
8.0
Oct 2015
5.0
6.9
7.8
Nov 2015
5.1
4.5
6.9
Dec 2015
5.0
4.6
6.3
Jan 2016
4.8
2.0
8.6
Feb 2016
4.9
3.0
9.7
Mar 2016
5.0
4.2
9.4
Apr 2016
5.1
2.7
8.6
May 2016
4.8
3.3
6.9
Jun 2016
4.9
3.3
7.0
Jul 2016
4.8
5.8
8.0
Aug 2016
4.9
5.3
6.9
Sep 2016
5.0
7.8
7.3
Oct 2016
4.9
7.7
5.7
Nov 2016
4.7
3.8
5.7
Dec 2016
4.7
3.3
6.1
Jan 2017
4.7
2.7
7.4
Feb 2017
4.6
7.7
9.5
Mar 2017
4.4
2.8
6.6
Apr 2017
4.4
5.9
5.0
May 2017
4.4
3.4
7.7
Jun 2017
4.3
6.4
7.1
Jul 2017
4.3
11.6
6.8
Aug 2017
4.4
9.3
5.9
Sep 2017
4.3
7.3
6.2
Oct 2017
4.2
5.6
6.0
Nov 2017
4.2
5.6
6.0
Dec 2017
4.1
4.1
5.7
Jan 2018
4.0
4.7
5.6
Feb 2018
4.1
5.4
5.6
Mar 2018
4.0
9.0
6.4
Apr 2018
4.0
3.8
5.1
May 2018
3.8
4.5
6.0
Jun 2018
4.0
7.4
7.0
Jul 2018
3.8
2.9
6.9
Aug 2018
3.8
6.6
5.4
Sep 2018
3.7
5.6
5.3
Oct 2018
3.8
6.2
4.5
Nov 2018
3.8
4.4
4.6
Dec 2018
3.9
3.0
4.3
Jan 2019
4.0
2.3
5.5
Feb 2019
3.8
1.1
5.8
Mar 2019
3.8
4.1
6.3
Apr 2019
3.6
4.4
5.2
May 2019
3.6
2.7
4.9
Jun 2019
3.6
3.0
6.9
Jul 2019
3.7
2.1
6.1
Aug 2019
3.7
4.5
4.5
Sep 2019
3.5
4.7
4.9
Oct 2019
3.6
3.7
5.1
Nov 2019
3.6
3.0
4.9
Dec 2019
3.6
3.1
3.5
Jan 2020
3.5
2.6
6.3
Feb 2020
3.5
2.7
6.1
Mar 2020
4.4
3.0
7.3
Apr 2020
14.7
7.6
19.3
May 2020
13.2
10.5
17.7
Jun 2020
11.0
10.0
15.3
Jul 2020
10.2
11.8
14.6
Aug 2020
8.4
12.4
12.6
Sep 2020
7.9
14.5
11.2
Oct 2020
6.9
12.7
9.0
Nov 2020
6.7
14.6
9.3
Dec 2020
6.7
5.7
10.9
Jan 2021
6.4
10.0
10.1
Feb 2021
6.2
8.9
9.1
Mar 2021
6.0
7.1
9.0
Apr 2021
6.0
11.8
8.3
May 2021
5.8
5.6
8.1
Jun 2021
5.9
8.9
9.4
Jul 2021
5.4
7.2
9.3
Aug 2021
5.2
5.1
7.5
Sep 2021
4.7
5.9
8.0
Oct 2021
4.6
6.1
6.4
Nov 2021
4.2
2.7
7.7
Dec 2021
3.9
4.5
5.3
Jan 2022
4.0
5.2
6.4
Feb 2022
3.8
5.6
6.8
Mar 2022
3.6
2.9
6.2
Apr 2022
3.6
2.8
4.2
May 2022
3.6
4.1
4.4
Jun 2022
3.6
3.4
3.9
Jul 2022
3.5
4.5
5.6
Aug 2022
3.7
3.8
6.2
Employment–population ratios for Native Hawaiians and Other Pacific Islanders, Two or More Races, and the total population, January 2003 to August 2022
Month
Total (seasonally adjusted)
Native Hawaiian or Other Pacific Islander (not seasonally adjusted)