
An official website of the United States government
An official website of the United States government
The .gov means it's official.
Federal government websites often end in .gov or .mil. Before sharing sensitive information,
make sure you're on a federal government site.
The site is secure.
The
https:// ensures that you are connecting to the official website and that any
information you provide is encrypted and transmitted securely.
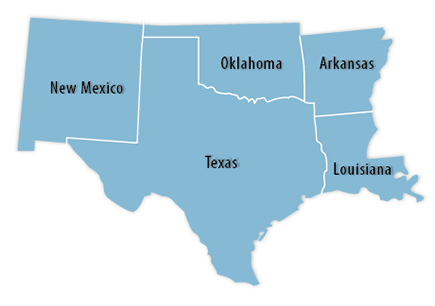
Click a state from the map or pick a state from the list:
Arkansas | Louisiana | New Mexico | Oklahoma | Texas
 Economic Summaries:
Economic Summaries are specialized products that combine data graphically from subjects such as unemployment, inflation, and wages into a single document for selected metropolitan areas. To view a specific area in this region, use the dropdown list below or click here.
The Consumer Price Index for All Urban Consumers (CPI-U) for the South increased 0.4 percent in October, the U.S. Bureau of Labor Statistics reported today.
The Consumer Price Index for All Urban Consumers (CPI-U), declined 0.6 percent for the two months ending in October 2022.
Prices in the West Region, as measured by the Consumer Price Index for All Urban Consumers (CPI-U), increased 0.7 percent in October, the U.S. Bureau of Labor Statistics reported today.
From December 2021 to March 2022 gross job gains in private sector establishments in Texas totaled 700,110, while gross job losses numbered 593,644, the U.S. Bureau of Labor Statistics reported today.
Households in the Dallas-Fort Worth-Arlington, TX, metropolitan area spent an average of $62,672 per year in 2020-21, the U.S. Bureau of Labor Statistics reported today.