Department of Labor Logo United States Department of Labor
Dot gov

The .gov means it's official.
Federal government websites often end in .gov or .mil. Before sharing sensitive information, make sure you're on a federal government site.

Https

The site is secure.
The https:// ensures that you are connecting to the official website and that any information you provide is encrypted and transmitted securely.

Catching up on Recent BLS Activities

At BLS, we highly value feedback that can help us improve our economic statistics. Three groups regularly advise us on serving the needs of data users: the BLS Data Users Advisory Committee, the BLS Technical Advisory Committee, and the Federal Economic Statistics Advisory Committee.

I cannot overstate the value of these committees. They have given us truly wonderful ideas. If you want to join these meetings, they are open to the public. You can learn more about future meetings directly from the committee links provided above. I welcome and encourage you to attend.

As the Commissioner of BLS, my role at these meetings is to give an overview of all the new and exciting things happening at BLS. I want to share these updates directly with you, too.

Budgets for Fiscal Years 2022 and 2023

Let’s start with the budgets for fiscal years (FY) 2022 and 2023. For full information on the FY 2022 budget, please see the Department of Labor FY 2022 budget page, which has information on the budget for BLS and other agencies within the Department. You also can see the FY 2023 proposed budget, released on March 28, 2022.

In addition to funding our existing programs, the President’s FY 2023 proposed budget requests additional funds for several BLS initiatives.

We are requesting $14.5 million to continue developing a new National Longitudinal Survey of Youth cohort. We are developing plans for a new cohort called the National Longitudinal Survey of Youth 2026 (NLSY26). The NLSY26 will build upon our experience and analysis of two ongoing earlier cohorts:

  • NLSY79: A sample of 12,686 people who were born in the years 1957–64. The survey began in 1979, when sample members were ages 14–22. BLS has followed this cohort of late baby boomers for more than 40 years, recording their lives from their teens into their 50s and early 60s.
  • NLSY97: A sample of 8,984 people who were born in the years 1980–84. The survey began in 1997, when sample members were ages 12–17. BLS has followed this cohort for more than 20 years, and sample members are now in their mid-30s to early 40s.

As in previous National Longitudinal Surveys cohorts, BLS plans to ask NLSY26 cohort members a core set of questions on employment, training, education, income, assets, marital status, fertility, health, and occupational and geographic mobility. We also plan to administer cognitive and noncognitive assessments. We are considering other topics as we consult with stakeholders and subject matter experts in a range of fields.

The FY 2023 budget request for BLS also includes the following:

Expanding Our Data

Moving beyond the budget, one topic that’s getting a lot of attention lately is inflation. We’ve been measuring and reporting on inflation at BLS for over a century, and we are always looking for ways to improve our measurement. The National Academy of Sciences, Committee on National Statistics, recently completed a study that focuses on ways to improve the Consumer Price Index. The report provided 37 consensus recommendations on how BLS can adapt to the rapidly changing digital landscape to improve CPI methods. BLS staff are now reviewing the report and developing an action plan based on the committee’s recommendations. You can read my blog about the report and the full report itself.

BLS recently began publishing monthly and quarterly labor force measures for the American Indian and Alaska Native population on February 4, 2022. We have these data back to 2000. Previously, we published data for American Indians and Alaska Natives only annually. You can learn more about the new data in one of my February blog posts.

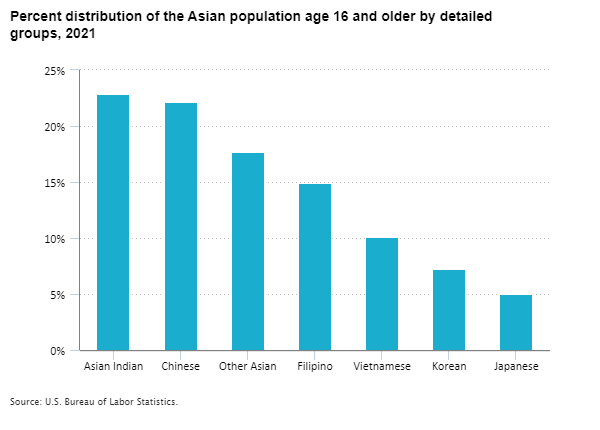
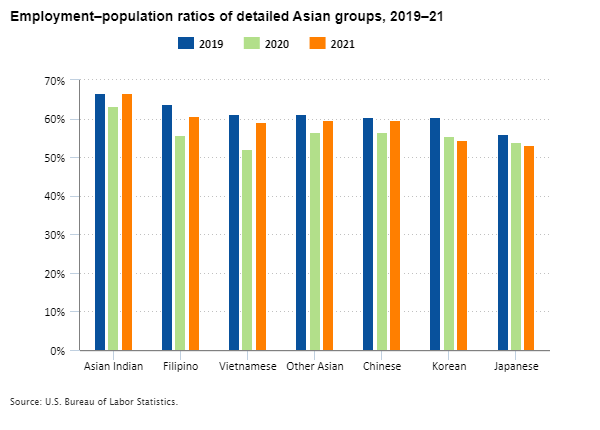
We now are evaluating whether we can begin publishing monthly and quarterly labor force data for the Native Hawaiian and Pacific Islander population and for detailed Asian groups. The populations of Native Hawaiians and Pacific Islanders and detailed Asian groups are relatively small, so we need to evaluate whether the Current Population Survey sample size is large enough to produce reliable monthly estimates for these groups. We currently publish annual data for Native Hawaiians and Pacific Islanders and detailed Asian groups in our report on Labor Force Characteristics by Race and Ethnicity.

Updates for Other Programs

I mentioned the National Longitudinal Surveys already, but the program is also doing other great work! In November 2021 we released data for the NLSY97 COVID-19 Supplement. We collected these data from February to May 2021. The survey asked questions about how the pandemic affected employment, health, and childcare. See our brief analysis of some of the COVID-19 data.

We’re also exploring how to measure the value of household production. BLS contracted with a vendor to consider how to use data from the American Time Use Survey on home production and impute the data to consumer units in the Consumer Expenditure Surveys. We expect to receive the recommendations by the end of the fiscal year.

Also in our Consumer Expenditure Surveys, we conducted an online survey test from November 2021 through January 2022 that will help us analyze alternative methods of collecting data. Response rates for most surveys have been declining for years. The COVID-19 pandemic also has made in-person interviewing less feasible. We are currently analyzing the results of the test to learn how we might reverse the trend of declining response rates and be ready for future events that might disrupt data collection.

Finally, we revamped the BLS Productivity program’s web space in April 2022. Information on labor productivity and total factor productivity is now available in a single cohesive and intuitive space. The new web space eliminates redundant material, improves consistency, and includes new material to fill information gaps. It truly enhances the customer experience!

I hope you find these updates useful and that they improve your experience with BLS data. We are always looking for opportunities to improve your experience with our gold standard economic statistics. Be on the lookout for more updates and improvements as we continuously adapt to meet your needs!

Update to the CareerInfo Mobile App Now Available

Occupational Outlook Handbook emblem

BLS has partnered with the U.S. Department of Labor’s Office of the Chief Information Officer to update the CareerInfo app with more content. The updated app is now available from the App Store and Google Play. CareerInfo presents information from the Occupational Outlook Handbook, the most popular BLS resource for career information.

The CareerInfo app helps you find information about employment, pay, job outlook, education and training requirements, and more for hundreds of detailed occupations. You can browse occupational groups and titles or search by occupation or keywords. Within occupational groups, the app allows you to sort by occupation title, projected growth, and typical education or median pay. You also now can browse top lists such as top paying, fastest growing, and most new jobs! Each occupational profile now includes more detailed information on what they do, work environment, how to become one, pay, and job outlook.

CareerInfo mobile app information about 20 fastest-growing occupations
CareerInfo mobile app pay and job data for carpenters

Future updates will add features that will let you personalize the app by filtering searches and by “liking,” saving, viewing, and comparing favorites.

Check out the new CareerInfo app and explore the occupational information from BLS. You’ll be glad you did!

Inflation, as Seen through the Bake Shop Window

At BLS, we are always looking for new ways to help readers understand the latest economic data. As measures of price change have garnered a heaping amount of financial coverage lately, the pastry chefs who publish our monthly inflation figures are experimenting with some new recipes to highlight current results. Our first attempt, straight out of the fryer: an inflation doughnut, in honor of National Doughnut Day.

We don’t mean to sugarcoat the impact of inflation on economic markets and household budgets, as high inflation can have disruptive and acrid consequences. Instead, we aim here to showcase the statistics in a window display that highlights the data in a fresh perspective. We start with an inflation doughnut, which is divided into sections to compare how many prices are increasing (inflation), decreasing (deflation), or remaining unchanged. You can display an inflation doughnut for just one month (think of it as just a doughnut hole) or over a longer time like a year or more (like a baker’s dozen). For this price change doughnut, we show all the ingredients to overall price change—the increases, the decreases, and the components with no change. Let’s look at an inflation doughnut example from the Consumer Price Index.

Consumer Price Index: Distribution of 12-month price changes for all goods and services, April 2022

Editor’s note: Data for this chart are available in the table below.

But not everyone likes doughnuts, including my editors, who seem partial to crullers and other more linear pastries. Apparently, these circular graphics can be hard to understand. So, the charts below focus on the same data, but with a different look. Nonetheless, the doughnut references are too good to pass up.

As a reminder, BLS has three monthly price programs, each of which produces many different estimates. By tracking each of these programs, you can learn more about price transmission through the production process. (Hmm, that sounds like a topic for a future blog.) Here’s a brief reminder about the BLS price programs:

  • The Import/Export Price Indexes contain data on changes in prices of nonmilitary goods and services traded between the United States and the rest of the world. As the new kid on the block, import and export price indexes are like those new gourmet doughnuts, perhaps topped with bacon and maple syrup.
  • The Producer Price Index (PPI) measures the average change over time in the selling prices received by domestic producers for their output. As the oldest price index program, the PPI is the workhorse, your basic powdered doughnut. It’s been around for years but still hits the spot.
  • The Consumer Price Index (CPI) measures the average change over time in the prices paid by urban consumers for a market basket of consumer goods and services. The CPI is the doughnut on the top shelf that gets most of the attention, maybe with chocolate frosting and multi-colored sprinkles.

Now that your mouth is watering, let’s look at the data.

Starting with import and export price data, we can see that nearly half of import item prices were higher over the past year, with 48 percent of all imports prices exhibiting inflationary trends; for imports of consumer goods, 42 percent had higher prices. We see similar trends  among exports.

Import Price Index: Distribution of 12-month price changes for all imports and import consumer goods, April 2022

Editor’s note: Data for this chart are available in the table below.

With the PPI, we focus on the share of industries showing price changes. Data are available for three different sectors. In keeping with the doughnut theme, goods-producing industries represent the jelly filling, with 98 percent of these industries exhibiting inflation over the past year. In the center, or the cake, 86 percent of service-providing industries were inflationary. Finally, the strawberry glaze on the outside looks at construction industries, with all showing inflation.

Producer Price Index: Distribution of 12-month price changes for industry groups, April 2022

Editor’s note: Data for this chart are available in the table below.

Finally, we look again at data for the CPI, but this time our doughnuts are flattened. Here we show the share of items in the market basket that experience rising or falling prices or no change. As a doughnut, the “core” CPI, that is, all items less food and energy, is somewhat vanilla, like Boston Cream filling. Over the past 12 months, about three-quarters of core items have shown price increases, 19 percent have shown price decreases, and a small percentage show no change. In contrast, the prices for food and energy pack more zest, like a chocolate glaze, showing considerable inflation—nearly 89 percent of items—with only a small amount of deflation. The food and energy inflation may be influenced by rising energy prices, perhaps related to an increase in late-night drives to the local bakery.

Consumer Price Index: Distribution of 12-month price changes for core and food and energy goods and services, April 2022

Editor’s note: Data for this chart are available in the table below.

We hope our tour of the pastry shop has added some spice to your understanding of price change statistics. For more traditional graphics showing trends in BLS data, check out the Graphics for Economic News Releases page on our website. Next time, try the pumpkin spice.

Consumer Price Index: Distribution of 12-month price changes for all goods and services, April 2022
IndexInflationDeflationNo change

CPI for All Urban Consumers

78.016.55.5
Import Price Index: Distribution of 12-month price changes for all imports and import consumer goods, April 2022
CategoryInflationDeflationNo change

All imports

47.713.738.6

Import consumer goods

42.012.845.3
Producer Price Index: Distribution of 12-month price changes for industry groups, April 2022
Industry groupInflationDeflationNo change

Goods-producing industries

9811

Service-providing industries

8659

Construction industries

10000
Consumer Price Index: Distribution of 12-month price changes for core and food and energy goods and services, April 2022
CategoryInflationDeflationNo change

Core

74.219.06.8

Food and energy

88.69.42.0

Employment Trends of Asians and Native Hawaiians and Other Pacific Islanders

May is Asian Pacific American Heritage Month, so let’s take a closer look at national employment statistics for Asians and for Native Hawaiians and Other Pacific Islanders. We’ll focus on how labor market conditions for these groups continue to recover from the effects of the COVID-19 pandemic.

BLS has been collecting data in the Current Population Survey on the labor market characteristics of people who identify their race as Asian or Native Hawaiian or Other Pacific Islander since 2003. Looking at historical data, the employment–population ratio—the percentage of the population that is employed—is generally higher for Asians and for Native Hawaiians or Other Pacific Islanders than the U.S. average. The ratio in 2019 was 62.3 percent for Asians and 66.2 percent for Native Hawaiians or Other Pacific Islanders, well above the national average of 60.8 percent. The ratios for all groups declined sharply in 2020 with the onset of the COVID-19 pandemic. Employment–population ratios had not yet fully recovered in 2021, but the ratios for Asians and Native Hawaiians or Other Pacific Islanders continued to be higher than the U.S. average. The greater likelihood of employment among Asians and Native Hawaiians or Other Pacific Islanders reflects the fact that larger shares of both groups are ages 25 to 54 than the overall population. People in this age range are more likely to be employed than people in younger and older age groups.

Employment–population ratios of the total population, Asians, and Native Hawaiians or Other Pacific Islanders, 2003–21 annual averages

Editor’s note: Data for this chart are available in the table below.

The following chart shows how the labor market improved in 2021 compared to 2020 but remained below its 2019 pre-pandemic level. The employment–population ratio increased by 1.6 percentage points from 2020 to 2021 but remained 2.4 percentage points below its 2019 level. Similarly, this ratio increased by 3.3 percentage points for Asians and 1.4 percentage points for Native Hawaiians or Other Pacific Islanders in 2021. The ratio for Asians in 2021 was still 1.7 percentage points lower than in 2019, while the ratio for Native Hawaiians or Other Pacific Islanders was still 4.0 percentage points lower.

Employment–population ratios of the total population, Asians, and Native Hawaiians or Other Pacific Islanders, 2019–21 annual averages

Editor’s note: Data for this chart are available in the table below.

The increase in the employment–population ratio between 2020 and 2021 varied for different groups within the Asian population. For example, this measure rose by 3.7 percentage points for Asian women and 2.9 percentage points for Asian men in 2021. The rise in the employment–population ratio was about twice as large for workers ages 16 to 24 (4.0 percentage points) and 25 to 54 (4.1 percentage points) than those age 55 and older (2.0 percentage points). Similarly, the increase in the percentage of foreign-born Asians (3.9 percentage points) who were employed was more than twice the increase for native-born Asians (1.8 percentage points). (Unfortunately, we can’t make these same comparisons for Native Hawaiians or Other Pacific Islanders because of their small sample size in the survey.)

Percentage point change in employment–population ratios for Asian groups, 2020 to 2021

Editor’s note: Data for this chart are available in the table below.

Asian Americans trace their roots to many different distinct and culturally diverse peoples. We collect information on seven different Asian groups—Asian Indian, Chinese, Filipino, Japanese, Korean, Vietnamese, and Other Asian. As shown in the chart below, Asian Indians and Chinese are the largest groups of Asian Americans. Japanese, at 5 percent, represent the smallest share.

Percent distribution of the Asian population age 16 and older by detailed groups, 2021

Editor’s note: Data for this chart are available in the table below.

Although the employment–population ratios for many of these groups increased in 2021, most remained below their 2019 pre-pandemic levels. After having the largest decline in their employment–population ratio from 2019 to 2020 (-9.2 percentage points), Vietnamese had the largest over-the-year gain in 2021 (7.1 percentage points) but remained 2.1 percentage points below the 2019 level. The employment–population ratio for Koreans in 2021, 5.9 percentage points below the 2019 level, had the largest decline over this 2-year period. The employment–population ratio of Asian Indians, however, had returned to the 2019 level in 2021.

Employment–population ratios of detailed Asian groups, 2019–21

Editor’s note: Data for this chart are available in the table below.

This is just a sample of the information available on the labor force status of Asian Americans and Native Hawaiians and Other Pacific Islanders. Explore some of our other resources to expand your knowledge.

Employment–population ratios, 2003–21 annual averages
YearTotal populationAsianNative Hawaiian or Other Pacific Islander

2003

62.3%62.4%63.6%

2004

62.363.067.4

2005

62.763.470.2

2006

63.164.270.6

2007

63.064.369.4

2008

62.264.367.8

2009

59.361.261.8

2010

58.559.960.1

2011

58.460.062.2

2012

58.660.163.0

2013

58.661.262.9

2014

59.060.463.5

2015

59.360.462.8

2016

59.760.965.7

2017

60.161.562.9

2018

60.461.664.9

2019

60.862.366.2

2020

56.857.360.8

2021

58.460.662.2
Employment–population ratios, 2019–21 annual averages
YearTotal populationAsianNative Hawaiian or Other Pacific Islander

2019

60.8%62.3%66.2%

2020

56.857.360.8

2021

58.460.662.2
Percentage point change in employment–population ratios for Asian groups, 2020 to 2021
CharacteristicChange from 2020 to 202120202021

Total

3.357.360.6

Men

2.965.468.3

Women

3.750.253.9

Age

Ages 16 to 24

4.033.437.4

Ages 25 to 54

4.173.577.6

Age 55 and older

2.037.339.3

Country of birth

Foreign born

3.957.060.9

Native born

1.857.559.3
Percent distribution of the Asian population age 16 and older by detailed groups, 2021
Asian groupPercent distribution

Asian Indian

22.9%

Chinese

22.1

Other Asian

17.7

Filipino

14.9

Vietnamese

10.1

Korean

7.2

Japanese

5.0
Employment–population ratios of detailed Asian groups, 2019–21
Year201920202021

Asian Indian

66.6%63.2%66.6%

Filipino

63.955.860.6

Vietnamese

61.252.059.1

Other Asian

61.156.559.7

Chinese

60.456.659.7

Korean

60.355.654.4

Japanese

56.153.853.1

A Blueprint for Modernizing the Consumer Price Index

At BLS, we never stop improving. We highly value any input from our data users, technical advisors, and other experts that helps us improve our high quality economic statistics. On May 3, 2022, we welcomed the latest evaluation of one of our statistical programs from the National Academy of Sciences, Committee on National Statistics (CNSTAT): Modernizing the Consumer Price Index for the 21st Century.

As we first reported in December 2019, CNSTAT convened an expert panel to study the Consumer Price Index (CPI). In our update in August 2021, we shared the panel membership and described the public meetings where the panel gathered information for its report. Now that the panel has completed its report, we share our plans to address their recommendations:

  • Adopt an alternative data strategy that significantly expands the use of new data sources and collection methods.
  • Improve the timeliness and quality of market basket weights in the CPI.
  • Continue research to enhance and inform the public’s understanding of consumer price change for shelter and medical care.
  • Calculate income-based CPIs and address methodology limitations.
  • Collaborate across the federal and international statistical system.

Use Alternative Data Sources

The chapter on modernizing elementary indexes focused on alternative data sources. Using data from sources beyond traditional surveys is a theme throughout the report. The recommendation to develop a household scanner data program would be a long-term strategy to address many challenges of calculating an accurate and timely CPI. BLS agrees with the panel to seek new data sources to improve every aspect of price index calculation: prices, expenditures (including the quantities purchased), quality adjustment, modeling, estimation, and imputation. Doing so will enable BLS to improve and expand the data we produce and provide users the data they need when they need it.

Even before the CNSTAT report, BLS has been busy building a pipeline of alternative data sources and improving our estimation methods for the CPI. Increasing the focus on alternative data should generate a steady flow of new data sources. This focus also will improve our ability to collect data through a variety of methods and give us new opportunities to address quality change. Consistent with our values to provide accessible information, we will keep you informed about new data sources and methods through the BLS website.

Improve Timeliness and Quality of Market Basket Weights

Beginning in January 2023, BLS plans to update market basket weights in the CPI annually, using 1 year of data. This change will immediately improve the timeliness of the market basket. BLS will continue our efforts to collect and process data more quickly to calculate the CPI using the most recent spending information.

BLS uses several data sources to adjust data collected in the Consumer Expenditure Surveys to calculate the CPI market basket weights. BLS will analyze the feasibility of using business data from the Bureau of Economic Analysis to adjust for categories consumers are reluctant to report, such as alcohol and tobacco. BLS plans to research alternative data sources to improve expenditure estimates when information from respondents is missing or aggregated.

BLS continues to believe collecting data directly from consumers is important to achieve our measurement objective. We are conducting research on a Household Cost Index, which requires household-level expenditure estimates to calculate household-specific indexes. As the panel notes, indexes for specific populations also require linking expenditures with information about households. Given current resources, we do not plan to expand our use of data from other sources in the next few years to supplement data collected in the Consumer Expenditure Surveys. In the future, BLS could pursue a household scanner data program to address the concerns the panel raises regarding the Consumer Expenditure Surveys.

Modernize Shelter

BLS is exploring alternative data sources to supplement rents collected in our housing survey and improve imputation of rental equivalence estimates for owner-occupied housing . We will continue to produce research indexes that meet user needs. BLS plans to publish research on a rent index focused on new tenants. Future research will target alternatives to rent data as a proxy for rental equivalence in predominantly owner-occupied areas and alternatives to the rental equivalence approach for high-end properties.

All BLS consumer indexes currently use a rental equivalence approach to target a cost-of-living measurement objective. Research indexes based on occupancy (renter and owner) will provide users with more insight. Some users need indexes for certain populations. As already mentioned, BLS will continue to research a Household Cost Index that uses a payments approach for owner-occupied housing. Some of these research indexes may ultimately be “promoted” to official status.

Modernize Medical Care

BLS uses an indirect method to price health insurance because directly pricing health insurance premiums is difficult. We have confirmed the retained earnings data incorporate rebates and will pursue further improvements to the indirect approach. We are pursuing implementation of claims data for physician’s and hospital outpatient services and will monitor hospital price transparency data as a possible data source in the future. Research comparing the indirect and direct methods is well underway and will be published initially as a research paper.

Calculate Supplemental Population Price Indexes

BLS continues research on producing price indexes by income groups. While BLS recognizes the limited benefit of reweighting the market basket to create indexes for particular population groups, we believe indexes for renters and owners will provide more insight into measuring price change for shelter. BLS will continue to seek cost-effective methods to study household behaviors and seek resources to collect household scanner data linked with demographics.

Collaborate with Other Statistical Organizations

Another theme throughout the report is communication and collaboration among statistical agencies. The panel recommended expanding collaboration, especially in research and data sharing. As the complexity of data sources and methods increases, BLS also needs to communicate with stakeholders to maintain transparency. Our practice is to announce on the BLS website in advance any changes to our data sources or methods. We will continue to share research index results to document the impact of these changes. BLS is looking into new ways of sharing data and improving transparency.

We value our partnerships with other agencies in the federal and international statistical community. In June 2022, we will share the CNSTAT recommendations with the Federal Economic Statistics Advisory Committee and discuss our plans. We will continue to seek out new opportunities to connect and collaborate with colleagues in the government, academic, and private sectors as we improve our statistics. We also will ensure our staff has the skills to innovate the modern methods of the future. In the last few years, BLS developed an in-house Data Science Training Program designed to bring awareness and improve the skills of BLS staff in key areas of data science. This annual program introduces a new cohort of BLS staff to these concepts, with plans to scale for larger cohorts in the future and include more specialized learning streams.

It is an exciting time to produce economic statistics. Their importance is paramount, and the opportunities have expanded to improve their accuracy, relevance, and timeliness. The CNSTAT’s latest report on the CPI is a valuable guide to help us keep improving and continue to produce gold standard data well into the future.