
An official website of the United States government
An official website of the United States government
The .gov means it's official.
Federal government websites often end in .gov or .mil. Before sharing sensitive information,
make sure you're on a federal government site.
The site is secure.
The
https:// ensures that you are connecting to the official website and that any
information you provide is encrypted and transmitted securely.
The Consumer Price Index (CPI) is a measure of the average change over time in the prices paid by urban consumers for a market basket of consumer goods and services. Indexes are available for the U.S. and various geographic areas. Average price data for select utility, automotive fuel, and food items are also available.
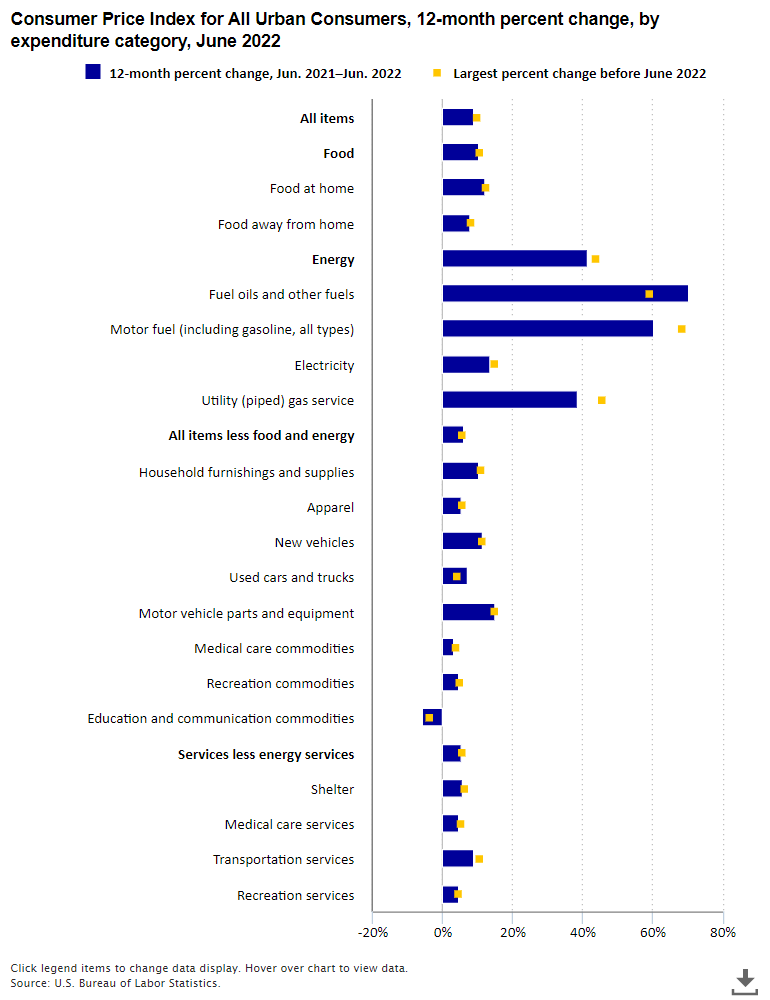
12-month percentage change, Consumer Price Index, selected categories, July 2022, not seasonally adjusted
Category
12-month percent change, Jul 2022
All items
8.5%
Food
10.9%
Food at home
13.1%
Cereals and bakery products
15.0%
Meats, poultry, fish, and eggs
10.9%
Dairy and related products
14.9%
Fruits and vegetables
9.3%
Nonalcoholic beverages and beverage materials
13.8%
Other food at home
15.8%
Food away from home
7.6%
Full service meals and snacks
8.9%
Limited service meals and snacks
7.2%
Energy
32.9%
Energy commodities
44.9%
Fuel oil
75.6%
Gasoline (all types)
44.0%
Energy services
18.8%
Electricity
15.2%
Natural gas (piped)
30.5%
All items less food and energy
5.9%
Commodities less food and energy commodities
7.0%
Apparel
5.1%
New vehicles
10.4%
Used cars and trucks
6.6%
Medical care commodities
3.7%
Alcoholic beverages
4.2%
Tobacco and smoking products
7.7%
Services less energy services
5.5%
Shelter
5.7%
Rent of primary residence
6.3%
Owners' equivalent rent of residences
5.8%
Medical care services
5.1%
Physicians' services
0.8%
Hospital services
3.9%
Transportation services
9.2%
Motor vehicle maintenance and repair
8.1%
Motor vehicle insurance
7.4%
Airline fare
27.7%
Consumer Price Index (CPI):
unchanged in Jul 2022
![]()
![]()
Unemployment Rate:
3.5% in Jul 2022
![]()
![]()
Payroll Employment:
+528,000(p) in Jul 2022
![]()
![]()
Average Hourly Earnings:
+$0.15(p) in Jul 2022
![]()
![]()
Producer Price Index - Final Demand:
+1.1%(p) in Jun 2022
![]()
![]()
Employment Cost Index (ECI):
+1.3% in 2nd Qtr of 2022
![]()
![]()
Productivity:
-4.6% in 2nd Qtr of 2022
![]()
![]()
U.S. Import Price Index:
+0.2% in Jun 2022
![]()
![]()
U.S. Export Price Index:
+0.7% in Jun 2022
![]()
![]()
08/10/2022
In July, the Consumer Price Index for All Urban Consumers was unchanged, seasonally adjusted, and
rose 8.5 percent over the last 12 months, not seasonally adjusted. The index for all items less
food and energy increased 0.3 percent in July (SA); up 5.9 percent over the year (NSA).
HTML
|
PDF
|
RSS
|
Charts
|
Local and Regional CPI
Over the 12 months ended June 2022, the Consumer Price Index for All Urban Consumers increased 9.1 percent. The 9.1-percent increase in the all items index was the largest 12-month increase since the 12-month period ending November 1981. read more »
The CPI and PPI mitigated the effects of the COVID-19 pandemic on their seasonally adjusted price indexes. read more »

During economic downturns, how do these measures help in analyzing price change, and what can we assume about consumption? This Beyond the Numbers article explores the final C-CPI-U during the Great Recession and the recession that occurred as a result of the COVID-19 pandemic. Additionally, the article evaluates consumer spending assumptions of the CPI-U and preliminary C-CPI-U during these recessionary periods to highlight challenges of lagged consumer spending data. read more »

This Spotlight on Statistics examines historical employment trends for wineries and other components of the beverage manufacturing industry. Additionally, the Spotlight looks at trends for wages, number of establishments, and consumer prices in the winery industry and compares them to trends among distilleries, breweries, and soft drink and ice manufacturing. Let's take a look. read more »