Alterations in atrial electrophysiology and tissue structure in a canine model of chronic atrial dilatation due to mitral regurgitation
- PMID: 12732604
- PMCID: PMC1995672
- DOI: 10.1161/01.CIR.0000066915.15187.51
Alterations in atrial electrophysiology and tissue structure in a canine model of chronic atrial dilatation due to mitral regurgitation
Abstract
Background: Clinically, chronic atrial dilatation is associated with an increased incidence of atrial fibrillation (AF), but the underlying mechanism is not clear. We have investigated atrial electrophysiology and tissue structure in a canine model of chronic atrial dilatation due to mitral regurgitation (MR).
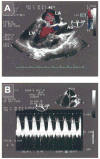
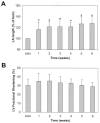
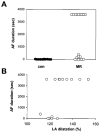
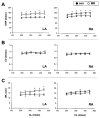
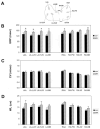
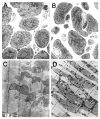
Methods and results: Thirteen control and 19 MR dogs (1 month after partial mitral valve avulsion) were studied. Dogs in the MR group were monitored using echocardiography and Holter recording. In open-chest follow-up experiments, electrode arrays were placed on the atria to investigate conduction patterns, effective refractory periods, and inducibility of AF. Alterations in tissue structure and ultrastructure were assessed in atrial tissue samples. At follow-up, left atrial length in MR dogs was 4.09+/-0.45 cm, compared with 3.25+/-0.28 at baseline (P<0.01), corresponding to a volume of 205+/-61% of baseline. At follow-up, no differences in atrial conduction pattern and conduction velocities were noted between control and MR dogs. Effective refractory periods were increased homogeneously throughout the left and right atrium. Sustained AF (>1 hour) was inducible in 10 of 19 MR dogs and none of 13 control dogs (P<0.01). In the dilated MR left atrium, areas of increased interstitial fibrosis and chronic inflammation were accompanied by increased glycogen ultrastructurally.
Conclusions: Chronic atrial dilatation in the absence of overt heart failure leads to an increased vulnerability to AF that is not based on a decrease in wavelength.
Figures


Similar articles
-
Alterations in electrophysiology and tissue structure of the left atrial posterior wall in a canine model of atrial fibrillation caused by chronic atrial dilatation.Circ J. 2007 Oct;71(10):1636-42. doi: 10.1253/circj.71.1636. Circ J. 2007. PMID: 17895564
-
The hemodynamic and atrial electrophysiologic consequences of chronic left atrial volume overload in a controllable canine model.J Thorac Cardiovasc Surg. 2018 Nov;156(5):1871-1879.e1. doi: 10.1016/j.jtcvs.2018.05.078. Epub 2018 Jun 5. J Thorac Cardiovasc Surg. 2018. PMID: 30336917 Free PMC article.
-
Effects of atrial fibrosis induced by mitral regurgitation on atrial electrophysiology and susceptibility to atrial fibrillation in pigs.Cardiovasc Pathol. 2019 May-Jun;40:32-40. doi: 10.1016/j.carpath.2019.01.006. Epub 2019 Jan 28. Cardiovasc Pathol. 2019. PMID: 30836303
-
Atrial Functional Mitral Regurgitation: JACC Review Topic of the Week.J Am Coll Cardiol. 2019 May 21;73(19):2465-2476. doi: 10.1016/j.jacc.2019.02.061. J Am Coll Cardiol. 2019. PMID: 31097168 Review.
-
Mechanistic insights into atrial functional mitral regurgitation: Far more complicated than just left atrial remodeling.Echocardiography. 2019 Jan;36(1):164-169. doi: 10.1111/echo.14249. Echocardiography. 2019. PMID: 30620100 Review.
Cited by
-
Left atrial remodeling in mitral regurgitation: A combined experimental-computational study.PLoS One. 2022 Jul 15;17(7):e0271588. doi: 10.1371/journal.pone.0271588. eCollection 2022. PLoS One. 2022. PMID: 35839240 Free PMC article.
-
Role of Inflammation in the Pathogenesis of Atrial Fibrillation.Front Physiol. 2022 Apr 14;13:862164. doi: 10.3389/fphys.2022.862164. eCollection 2022. Front Physiol. 2022. PMID: 35492601 Free PMC article. Review.
-
Incremental Prognosis by Left Atrial Functional Assessment: The Left Atrial Coupling Index in Patients With Floppy Mitral Valves.J Am Heart Assoc. 2022 May 3;11(9):e024814. doi: 10.1161/JAHA.121.024814. Epub 2022 Apr 26. J Am Heart Assoc. 2022. PMID: 35470696 Free PMC article.
-
Clinical implications of left atrial reverse remodelling after cardiac resynchronization therapy.Eur Heart J Cardiovasc Imaging. 2022 Jun 1;23(6):730-740. doi: 10.1093/ehjci/jeac042. Eur Heart J Cardiovasc Imaging. 2022. PMID: 35213709 Free PMC article.
-
Ranolazine: An Old Drug with Emerging Potential; Lessons from Pre-Clinical and Clinical Investigations for Possible Repositioning.Pharmaceuticals (Basel). 2021 Dec 25;15(1):31. doi: 10.3390/ph15010031. Pharmaceuticals (Basel). 2021. PMID: 35056088 Free PMC article. Review.
Publication types
MeSH terms
Grant support
LinkOut - more resources
Full Text Sources
Other Literature Sources

