Follow
BLS-Labor Statistics
@BLS_gov
BLS has a stat for that! Statistics you can trust to make informed decisions, whether you're a worker, jobseeker, student, employer, investor, or policymaker.
bls.govJoined June 2012
BLS-Labor Statistics’s Tweets

7
9
Payroll employment rises by 372,000 in June; unemployment rate remains at 3.6% go.usa.gov/vrK #JobsReport #BLSdata
13
211
219
Unemployment rates were lower in May 2022 than a year earlier in 385 of 389 metro areas go.usa.gov/xScb6 #BLSdata

read image description
ALT
6
11
read image description
ALT
2
2
Unemployment rates were lower in May 2022 than a year earlier in 385 of 389 metro areas go.usa.gov/xScb6 #BLSdata

read image description
ALT
1
11
16
Topics to follow
Sign up to get Tweets about the Topics you follow in your Home timeline.
Carousel
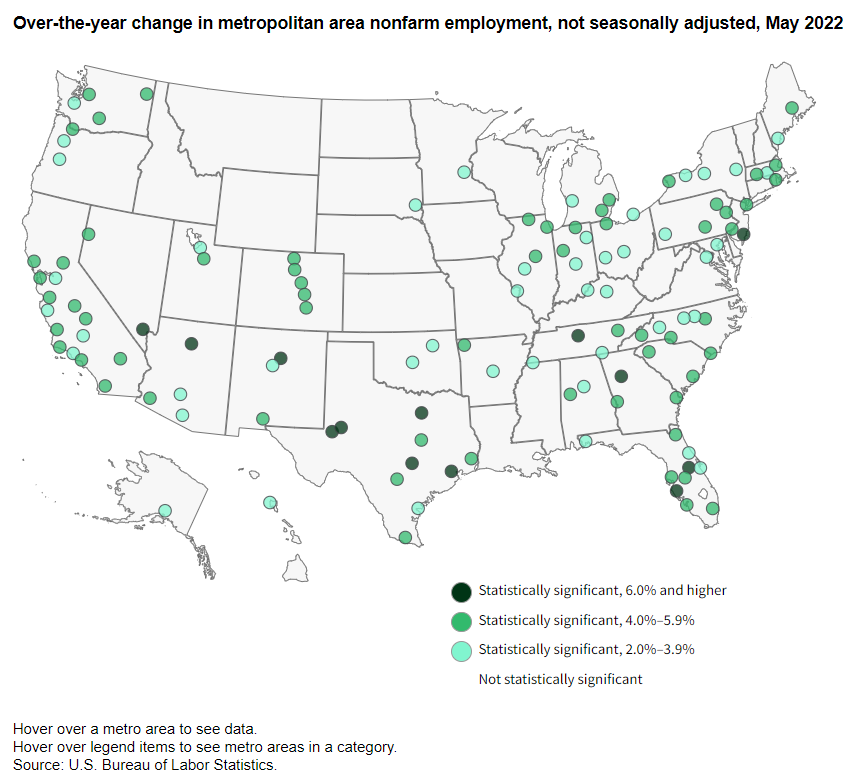
Employment up at least 6.0 percent over the year in 13 metro areas in May 2022 go.usa.gov/xSqf5 #BLSdata
read image description
ALT
1
6
11
Employment up at least 6.0 percent over the year in 13 metro areas in May 2022 go.usa.gov/xSqf5 #BLSdata

read image description
ALT
11
18
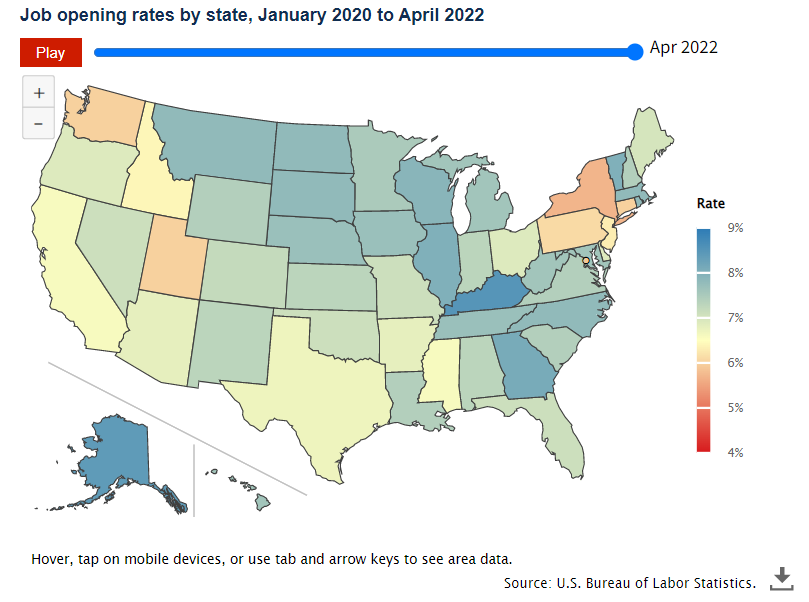
See our interactive graphics on today’s new job openings and labor turnover numbers go.usa.gov/xkJ39 #JOLTS #BLSdata #DataViz
6
6
15
12
read image description
ALT
6
15

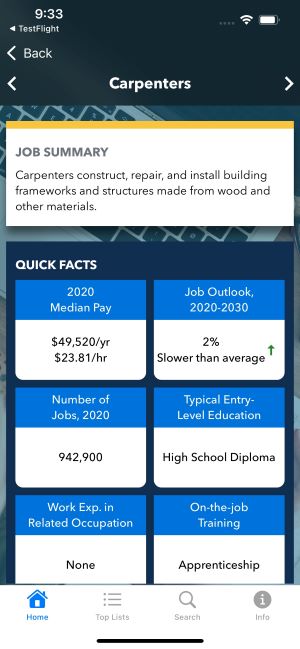
Whether you’re looking for a new occupation or just getting started in your career, it helps to know what you can expect. The updated CareerInfo app puts that information in the palm of your hand.

9
14

read image description
ALT
8
13
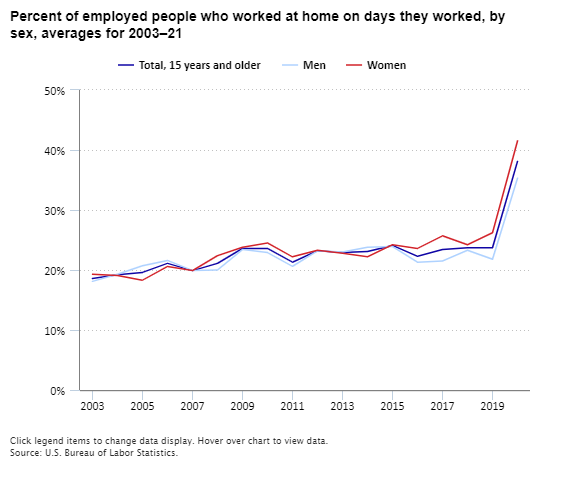
Employed women more likely than employed men to work at home on days they worked in 2021 go.usa.gov/xJzB6 #BLSdata

read image description
ALT
10
11
3
4
Employed women more likely than employed men to work at home on days they worked in 2021 go.usa.gov/xJzB6 #BLSdata
read image description
ALT
4
3
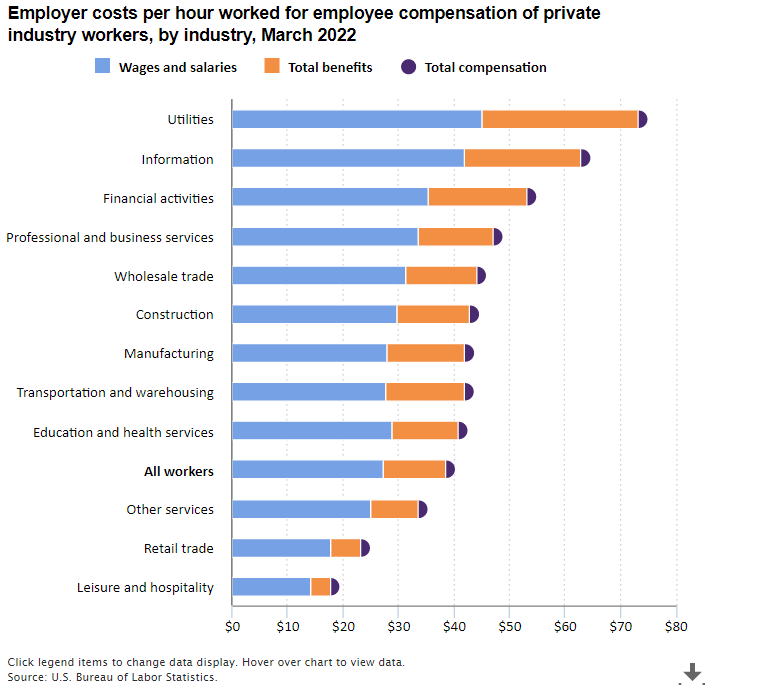
Compensation costs in private industry averaged $38.61 per hour worked in March 2022 go.usa.gov/xJetZ #BLSdata

read image description
ALT
2
6
10
Compensation costs in private industry averaged $38.61 per hour worked in March 2022 go.usa.gov/xJetZ #BLSdata
read image description
ALT
1
4
3
See our interactive graphics on productivity and costs in service-providing industries go.usa.gov/xwYhd #BLSdata #DataViz
2
1
Productivity increases in 24 of 30 selected service-providing industries in 2021 go.usa.gov/GWN #BLSdata
5
2
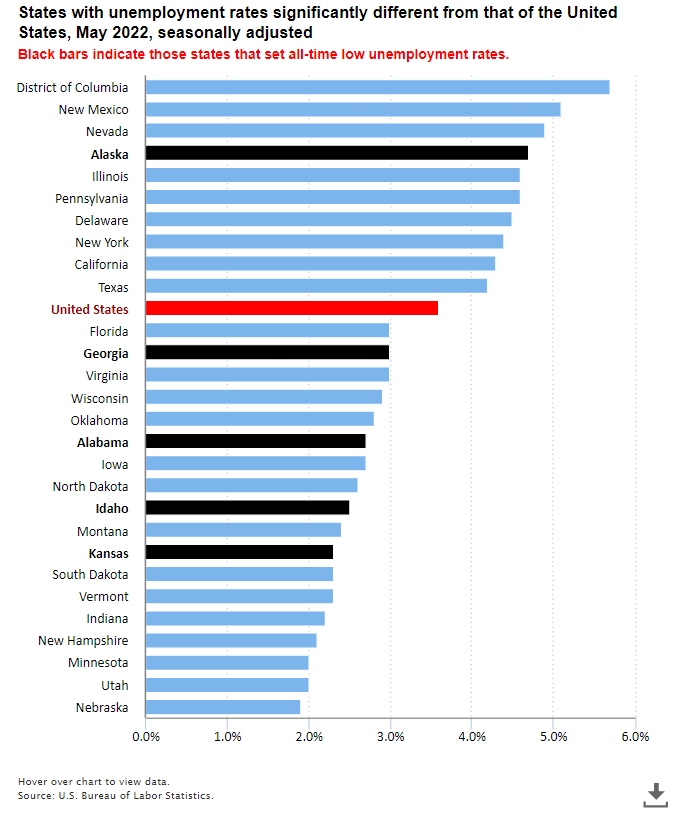
18 states had jobless rates lower than U.S. rate in May 2022; 9 states and D.C. had higher rates go.usa.gov/xJMX9 #BLSdata
read image description
ALT
1
7
6
18 states had jobless rates lower than U.S. rate in May 2022; 9 states and D.C. had higher rates go.usa.gov/xJMX9 #BLSdata

read image description
ALT
6
8
See our interactive graphics on today’s new #BLSdata on state job openings and labor turnover go.usa.gov/xMecY #DataViz #JOLTS
2
2
See our interactive graphics on today’s new metro area #employment and #unemployment data go.usa.gov/xnyHT #BLSdata #DataViz
2
1
April job openings rates down in 12 states, up in 6; quits rates down in 10, up in 4 go.usa.gov/xMe3W #JOLTS #BLSdata
3
6
May jobless rates down over the year in 385 of 389 metro areas; payroll jobs up in 122 go.usa.gov/vfp #BLSdata
4
4
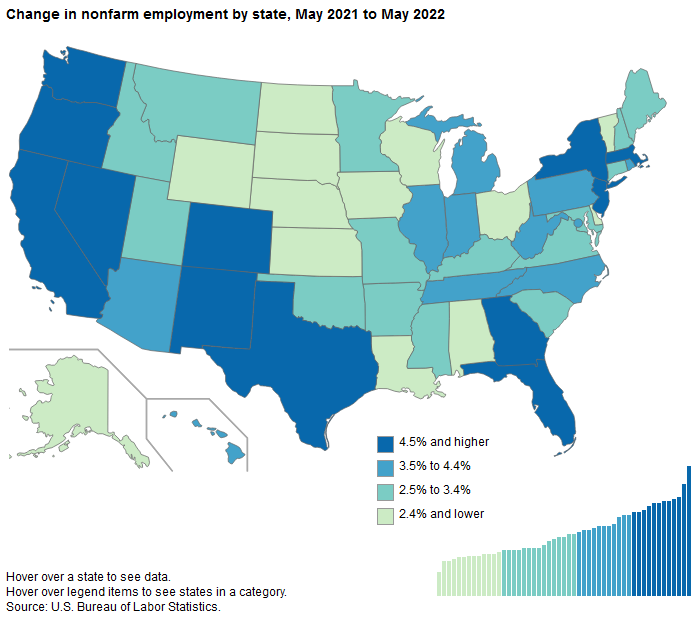
Nonfarm payroll employment increased in 48 states and DC from May 2021 to May 2022 go.usa.gov/xJ6m6 #BLSdata
read image description
ALT
4
7
Nonfarm payroll employment increased in 48 states and DC from May 2021 to May 2022 go.usa.gov/xJ6m6 #BLSdata

read image description
ALT
8
10
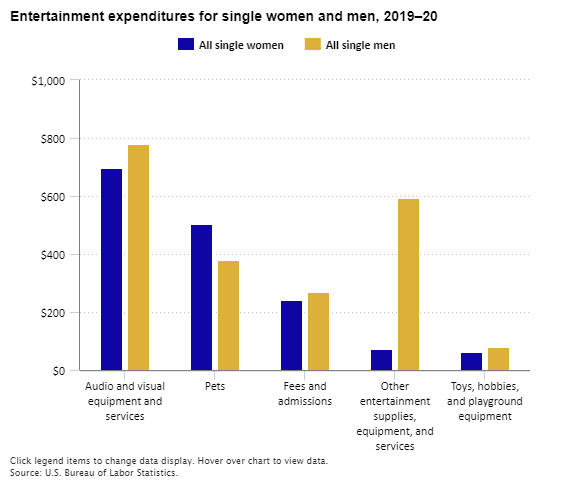
Single men outspent single women on entertainment in 2019–20, but single women spent more on pets go.usa.gov/xJstT #BLSdata

read image description
ALT
4
4
. takes a deep dive into national employment statistics for Asians and for Native Hawaiians and Other Pacific Islanders:
4
8
7
Single men outspent single women on entertainment in 2019–20, but single women spent more on pets go.usa.gov/xJstT #BLSdata
read image description
ALT
10
9
Join at #ALAAC22, the biggest library event of the year with 160 education sessions, memorable speakers, networking activities, and more! #BLSData #ALATogetherAgain
read image description
ALT
1

read image description
ALT
10
9
We'll be exhibiting at #ALAAC22, the world's biggest library event taking place June 23–28, 2022! The conference has more than 550 exhibitors, top-tier authors, and networking activities. Stop by #BLSData booth 3626! #ALATogetherAgain

read image description
ALT
1
1
1
3
Visit our exhibit booth 3626 to learn about our #BLSData free publications and website features. #ALAAC22 #ALATogetherAgain
read image description
ALT
1
read image description
ALT
6
7
read image description
ALT
2