
An official website of the United States government
An official website of the United States government
The .gov means it's official.
Federal government websites often end in .gov or .mil. Before sharing sensitive information,
make sure you're on a federal government site.
The site is secure.
The
https:// ensures that you are connecting to the official website and that any
information you provide is encrypted and transmitted securely.
The Current Employment Statistics (CES) program produces detailed industry estimates of nonfarm employment, hours, and earnings of workers on payrolls. CES National Estimates produces data for the nation, and CES State and Metro Area produces estimates for all 50 States, the District of Columbia, Puerto Rico, the Virgin Islands, and about 450 metropolitan areas and divisions.
Each month, CES surveys approximately 131,000 businesses and government agencies, representing approximately 670,000 individual worksites.
- 1-month
- 3-month
- 6-month
- 12-month
Employment change by industry with confidence intervals, May 2022, seasonally adjusted, in thousands
Industry
1-month net change
1-month 90-percent confidence interval
3-month net change
3-month 90-percent confidence interval
6-month net change
6-month 90-percent confidence interval
12-month net change
12-month 90-percent confidence interval
Total nonfarm
390
116.1
1,224
187.3
3,030
259.9
6,541
339.9
Total private
333
109.7
1,123
177.1
2,880
243.8
6,253
317.1
Goods-producing
59
34.1
213
51.7
452
72.5
841
107.6
Service providing
331
110.0
1,011
180.0
2,578
248.7
5,700
322.6
Mining and logging
5
5.0
18
10.2
36
17.5
58
27.4
Construction
36
22.4
58
36.4
162
52.0
283
71.4
Manufacturing
18
23.2
137
34.4
254
46.9
500
75.7
Wholesale trade
14.1
14.8
62.9
35.5
120.5
45.7
196.1
56.7
Retail trade
-60.7
22.1
-71.3
35.3
199.6
60.7
442.9
78.6
Transportation and warehousing
47.0
15.4
96.9
24.4
246.4
39.3
477.2
54.8
Utilities
0.5
2.2
0.5
4.8
0.6
8.3
-3.0
10.5
Information
16
19.4
49
57.7
63
87.1
164
105.8
Financial activities
8
15.3
54
24.1
99
39.8
201
57.8
Professional and business services
75
47.6
218
75.2
484
98.7
1,191
137.3
Education and health services
74
46.5
185
66.8
384
79.3
638
110.8
Leisure and hospitality
84
55.1
271
88.6
719
127.7
1,808
160.3
Other services
16
22.9
44
33.6
112
47.9
297
61.0
Government
57
38.2
101
60.8
150
90.1
288
122.3
Note: Significant changes are calculated at a 90-percent confidence level. The variance for total nonfarm is an approximation because government and rail transportation are not based on a probability sample
06/03/2022
Total nonfarm payroll employment rose by 390,000 in May, and the unemployment rate
remained at 3.6 percent. Notable job gains occurred in leisure and hospitality, in
professional and business services, and in transportation and warehousing.
Employment in retail trade declined.
HTML
|
PDF
|
RSS
|
Charts
|
Commissioner's Statement
06/10/2022
Real average hourly earnings for all employees decreased 0.6 percent in May, seasonally adjusted. Average hourly earnings increased 0.3 percent, and CPI-U increased 1.0 percent. Real average weekly earnings decreased 0.7 percent.
HTML
|
PDF
|
RSS
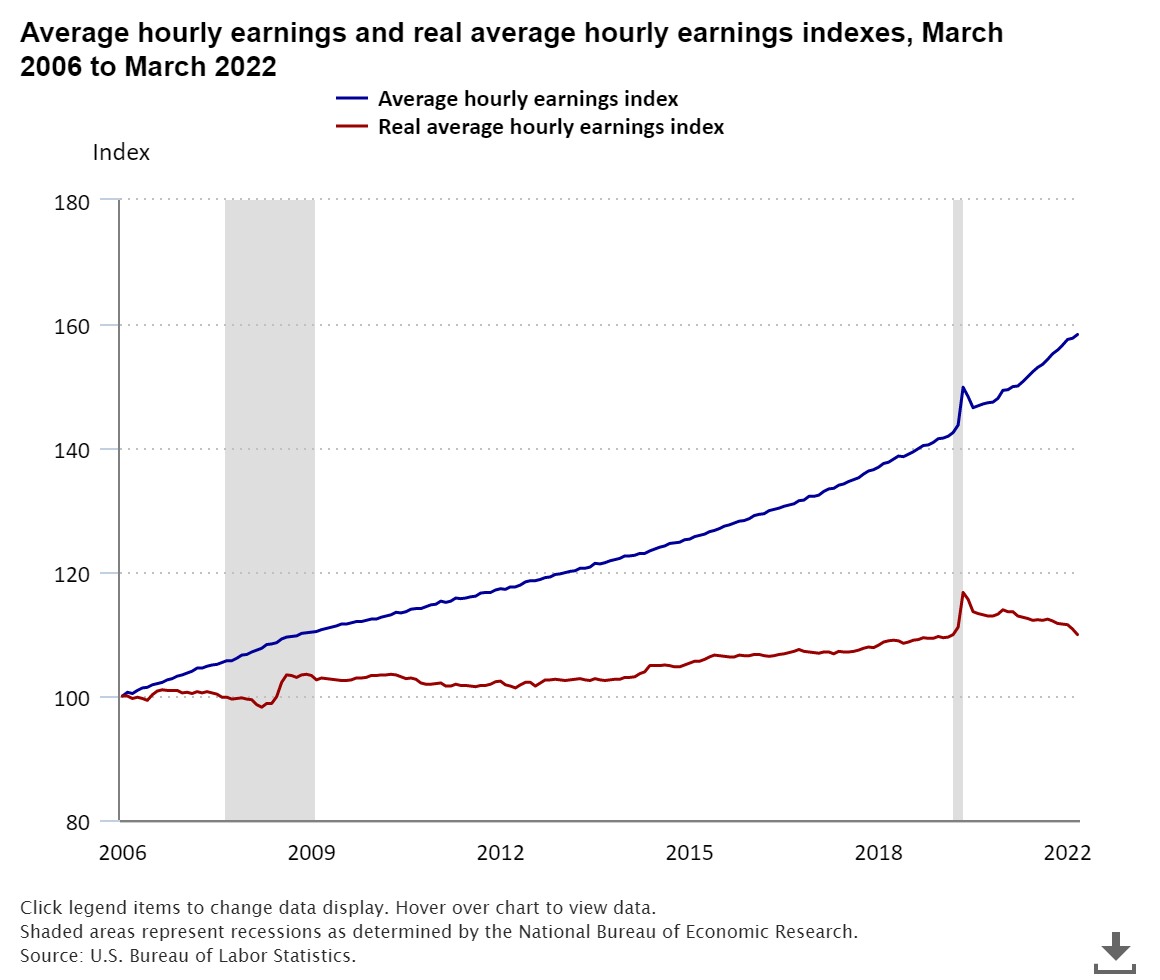
Real average hourly earnings for all employees decreased 0.8 percent from February to March 2022. This result stems from an increase of 0.4 percent in average hourly earnings combined with an increase of 1.2 percent in the Consumer Price Index for All Urban Consumers. read more »

Every 10 years, the U.S. Census Bureau conducts a full count of the entire population of the United States, as mandated by the U.S. Constitution. To achieve this mission, the Census Bureau hires hundreds of thousands of temporary workers. These workers are reflected in the Current Employment Statistics (CES) survey employment estimates. read more »

This article provides an analysis of the recent employment declines in the rail transportation industry. read more »
Change in Total Nonfarm Payroll Employment:
+390,000(p) in May 2022
![]()
Change in Total Private Average Hourly Earnings for All Employees:
+$0.10(p) in May 2022
![]()
Change in Total Private Average Weekly Hours for All Employees:
unchanged in May 2022
![]()
Percent change in Total Private Aggregate Weekly Hours for All Employees:
+0.3%(p) in May 2022
![]()
Change in Manufacturing Average Weekly Hours for All Employees:
-0.1(p) in May 2022
![]()
Change in Manufacturing Average Weekly Overtime for All Employees:
-0.1(p) in May 2022
![]()
Change in Total Private Real Average Hourly Earnings for All Employees:
-$0.07(p) in May 2022
![]()