An official website of the United States government
An official website of the United States government
The .gov means it's official.
Federal government websites often end in .gov or .mil. Before sharing sensitive information,
make sure you're on a federal government site.
The site is secure.
The
https:// ensures that you are connecting to the official website and that any
information you provide is encrypted and transmitted securely.
June 17, 2022
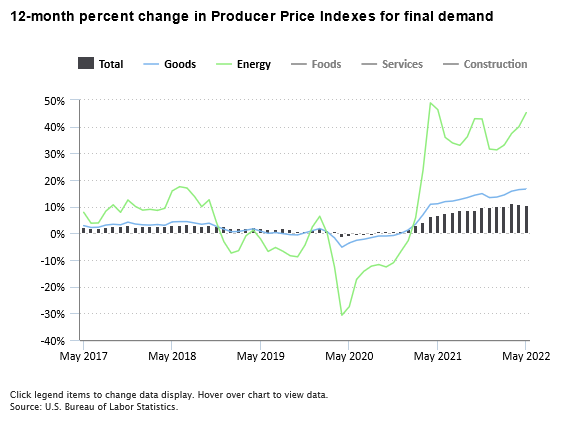
Producer prices for final demand increased 10.8 percent, not seasonally adjusted, for the year ended in May 2022. This rise followed advances of 10.9% percent for the year ended in April and 11.5 percent for the year ended in March.
read full article »June 16, 2022

Real average hourly earnings for all employees on private nonfarm payrolls decreased 3.0 percent from May 2021 to May 2022. The change in real average hourly earnings combined with a decrease of 0.9 percent in the average workweek resulted in a 3.9-percent decrease in real average weekly earnings over this period. The Consumer Price Index for All Urban Consumers (CPI-U) rose 8.5 percent for the year ending May 2022.
June 15, 2022

Software developers (with employment of nearly 1.4 million), project management specialists (743,860), and school bus drivers (361,420) were among the largest newly defined occupations in the 2018 Standard Occupational Classification (SOC) system. These were among more than 50 occupations for which employment and wage estimates were published for the first time in the May 2021 Occupational Employment and Wage Statistics data.
June 14, 2022

From May 2021 to May 2022, the Consumer Price Index for All Urban Consumers increased 8.6 percent, the largest 12-month increase since the period ending December 1981.
June 13, 2022

Employer-provided student loan repayment benefits were available to 4 percent of civilian workers in March 2021.