Department of Labor Logo United States Department of Labor
Dot gov

The .gov means it's official.
Federal government websites often end in .gov or .mil. Before sharing sensitive information, make sure you're on a federal government site.

Https

The site is secure.
The https:// ensures that you are connecting to the official website and that any information you provide is encrypted and transmitted securely.

Inflation, as Seen through the Bake Shop Window

At BLS, we are always looking for new ways to help readers understand the latest economic data. As measures of price change have garnered a heaping amount of financial coverage lately, the pastry chefs who publish our monthly inflation figures are experimenting with some new recipes to highlight current results. Our first attempt, straight out of the fryer: an inflation doughnut, in honor of National Doughnut Day.

We don’t mean to sugarcoat the impact of inflation on economic markets and household budgets, as high inflation can have disruptive and acrid consequences. Instead, we aim here to showcase the statistics in a window display that highlights the data in a fresh perspective. We start with an inflation doughnut, which is divided into sections to compare how many prices are increasing (inflation), decreasing (deflation), or remaining unchanged. You can display an inflation doughnut for just one month (think of it as just a doughnut hole) or over a longer time like a year or more (like a baker’s dozen). For this price change doughnut, we show all the ingredients to overall price change—the increases, the decreases, and the components with no change. Let’s look at an inflation doughnut example from the Consumer Price Index.

Consumer Price Index: Distribution of 12-month price changes for all goods and services, April 2022

Editor’s note: Data for this chart are available in the table below.

But not everyone likes doughnuts, including my editors, who seem partial to crullers and other more linear pastries. Apparently, these circular graphics can be hard to understand. So, the charts below focus on the same data, but with a different look. Nonetheless, the doughnut references are too good to pass up.

As a reminder, BLS has three monthly price programs, each of which produces many different estimates. By tracking each of these programs, you can learn more about price transmission through the production process. (Hmm, that sounds like a topic for a future blog.) Here’s a brief reminder about the BLS price programs:

  • The Import/Export Price Indexes contain data on changes in prices of nonmilitary goods and services traded between the United States and the rest of the world. As the new kid on the block, import and export price indexes are like those new gourmet doughnuts, perhaps topped with bacon and maple syrup.
  • The Producer Price Index (PPI) measures the average change over time in the selling prices received by domestic producers for their output. As the oldest price index program, the PPI is the workhorse, your basic powdered doughnut. It’s been around for years but still hits the spot.
  • The Consumer Price Index (CPI) measures the average change over time in the prices paid by urban consumers for a market basket of consumer goods and services. The CPI is the doughnut on the top shelf that gets most of the attention, maybe with chocolate frosting and multi-colored sprinkles.

Now that your mouth is watering, let’s look at the data.

Starting with import and export price data, we can see that nearly half of import item prices were higher over the past year, with 48 percent of all imports prices exhibiting inflationary trends; for imports of consumer goods, 42 percent had higher prices. We see similar trends  among exports.

Import Price Index: Distribution of 12-month price changes for all imports and import consumer goods, April 2022

Editor’s note: Data for this chart are available in the table below.

With the PPI, we focus on the share of industries showing price changes. Data are available for three different sectors. In keeping with the doughnut theme, goods-producing industries represent the jelly filling, with 98 percent of these industries exhibiting inflation over the past year. In the center, or the cake, 86 percent of service-providing industries were inflationary. Finally, the strawberry glaze on the outside looks at construction industries, with all showing inflation.

Producer Price Index: Distribution of 12-month price changes for industry groups, April 2022

Editor’s note: Data for this chart are available in the table below.

Finally, we look again at data for the CPI, but this time our doughnuts are flattened. Here we show the share of items in the market basket that experience rising or falling prices or no change. As a doughnut, the “core” CPI, that is, all items less food and energy, is somewhat vanilla, like Boston Cream filling. Over the past 12 months, about three-quarters of core items have shown price increases, 19 percent have shown price decreases, and a small percentage show no change. In contrast, the prices for food and energy pack more zest, like a chocolate glaze, showing considerable inflation—nearly 89 percent of items—with only a small amount of deflation. The food and energy inflation may be influenced by rising energy prices, perhaps related to an increase in late-night drives to the local bakery.

Consumer Price Index: Distribution of 12-month price changes for core and food and energy goods and services, April 2022

Editor’s note: Data for this chart are available in the table below.

We hope our tour of the pastry shop has added some spice to your understanding of price change statistics. For more traditional graphics showing trends in BLS data, check out the Graphics for Economic News Releases page on our website. Next time, try the pumpkin spice.

Consumer Price Index: Distribution of 12-month price changes for all goods and services, April 2022
IndexInflationDeflationNo change

CPI for All Urban Consumers

78.016.55.5
Import Price Index: Distribution of 12-month price changes for all imports and import consumer goods, April 2022
CategoryInflationDeflationNo change

All imports

47.713.738.6

Import consumer goods

42.012.845.3
Producer Price Index: Distribution of 12-month price changes for industry groups, April 2022
Industry groupInflationDeflationNo change

Goods-producing industries

9811

Service-providing industries

8659

Construction industries

10000
Consumer Price Index: Distribution of 12-month price changes for core and food and energy goods and services, April 2022
CategoryInflationDeflationNo change

Core

74.219.06.8

Food and energy

88.69.42.0

Employment Trends of Asians and Native Hawaiians and Other Pacific Islanders

May is Asian Pacific American Heritage Month, so let’s take a closer look at national employment statistics for Asians and for Native Hawaiians and Other Pacific Islanders. We’ll focus on how labor market conditions for these groups continue to recover from the effects of the COVID-19 pandemic.

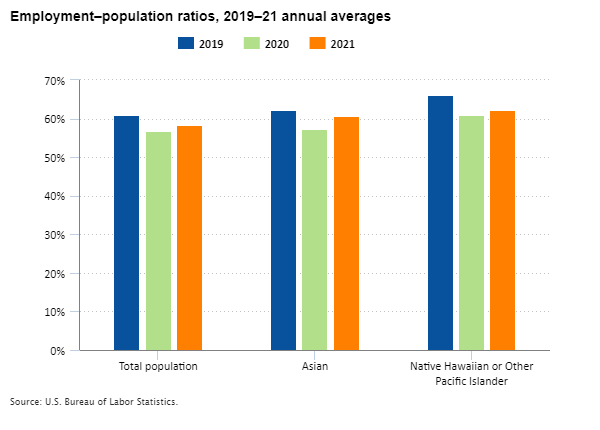
BLS has been collecting data in the Current Population Survey on the labor market characteristics of people who identify their race as Asian or Native Hawaiian or Other Pacific Islander since 2003. Looking at historical data, the employment–population ratio—the percentage of the population that is employed—is generally higher for Asians and for Native Hawaiians or Other Pacific Islanders than the U.S. average. The ratio in 2019 was 62.3 percent for Asians and 66.2 percent for Native Hawaiians or Other Pacific Islanders, well above the national average of 60.8 percent. The ratios for all groups declined sharply in 2020 with the onset of the COVID-19 pandemic. Employment–population ratios had not yet fully recovered in 2021, but the ratios for Asians and Native Hawaiians or Other Pacific Islanders continued to be higher than the U.S. average. The greater likelihood of employment among Asians and Native Hawaiians or Other Pacific Islanders reflects the fact that larger shares of both groups are ages 25 to 54 than the overall population. People in this age range are more likely to be employed than people in younger and older age groups.

Employment–population ratios of the total population, Asians, and Native Hawaiians or Other Pacific Islanders, 2003–21 annual averages

Editor’s note: Data for this chart are available in the table below.

The following chart shows how the labor market improved in 2021 compared to 2020 but remained below its 2019 pre-pandemic level. The employment–population ratio increased by 1.6 percentage points from 2020 to 2021 but remained 2.4 percentage points below its 2019 level. Similarly, this ratio increased by 3.3 percentage points for Asians and 1.4 percentage points for Native Hawaiians or Other Pacific Islanders in 2021. The ratio for Asians in 2021 was still 1.7 percentage points lower than in 2019, while the ratio for Native Hawaiians or Other Pacific Islanders was still 4.0 percentage points lower.

Employment–population ratios of the total population, Asians, and Native Hawaiians or Other Pacific Islanders, 2019–21 annual averages

Editor’s note: Data for this chart are available in the table below.

The increase in the employment–population ratio between 2020 and 2021 varied for different groups within the Asian population. For example, this measure rose by 3.7 percentage points for Asian women and 2.9 percentage points for Asian men in 2021. The rise in the employment–population ratio was about twice as large for workers ages 16 to 24 (4.0 percentage points) and 25 to 54 (4.1 percentage points) than those age 55 and older (2.0 percentage points). Similarly, the increase in the percentage of foreign-born Asians (3.9 percentage points) who were employed was more than twice the increase for native-born Asians (1.8 percentage points). (Unfortunately, we can’t make these same comparisons for Native Hawaiians or Other Pacific Islanders because of their small sample size in the survey.)

Percentage point change in employment–population ratios for Asian groups, 2020 to 2021

Editor’s note: Data for this chart are available in the table below.

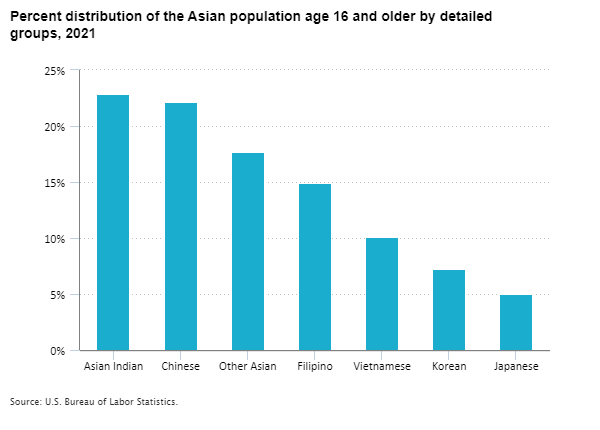
Asian Americans trace their roots to many different distinct and culturally diverse peoples. We collect information on seven different Asian groups—Asian Indian, Chinese, Filipino, Japanese, Korean, Vietnamese, and Other Asian. As shown in the chart below, Asian Indians and Chinese are the largest groups of Asian Americans. Japanese, at 5 percent, represent the smallest share.

Percent distribution of the Asian population age 16 and older by detailed groups, 2021

Editor’s note: Data for this chart are available in the table below.

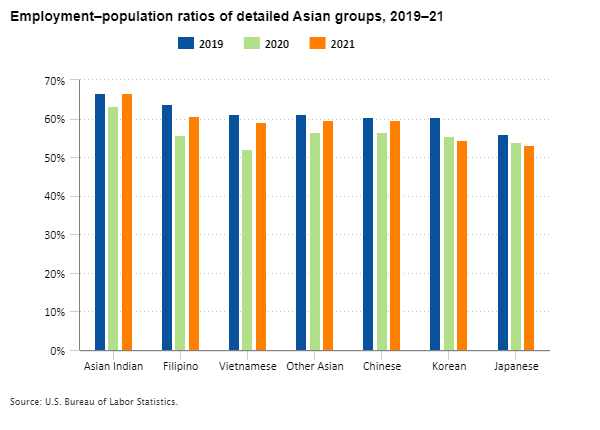
Although the employment–population ratios for many of these groups increased in 2021, most remained below their 2019 pre-pandemic levels. After having the largest decline in their employment–population ratio from 2019 to 2020 (-9.2 percentage points), Vietnamese had the largest over-the-year gain in 2021 (7.1 percentage points) but remained 2.1 percentage points below the 2019 level. The employment–population ratio for Koreans in 2021, 5.9 percentage points below the 2019 level, had the largest decline over this 2-year period. The employment–population ratio of Asian Indians, however, had returned to the 2019 level in 2021.

Employment–population ratios of detailed Asian groups, 2019–21

Editor’s note: Data for this chart are available in the table below.

This is just a sample of the information available on the labor force status of Asian Americans and Native Hawaiians and Other Pacific Islanders. Explore some of our other resources to expand your knowledge.

Employment–population ratios, 2003–21 annual averages
YearTotal populationAsianNative Hawaiian or Other Pacific Islander

2003

62.3%62.4%63.6%

2004

62.363.067.4

2005

62.763.470.2

2006

63.164.270.6

2007

63.064.369.4

2008

62.264.367.8

2009

59.361.261.8

2010

58.559.960.1

2011

58.460.062.2

2012

58.660.163.0

2013

58.661.262.9

2014

59.060.463.5

2015

59.360.462.8

2016

59.760.965.7

2017

60.161.562.9

2018

60.461.664.9

2019

60.862.366.2

2020

56.857.360.8

2021

58.460.662.2
Employment–population ratios, 2019–21 annual averages
YearTotal populationAsianNative Hawaiian or Other Pacific Islander

2019

60.8%62.3%66.2%

2020

56.857.360.8

2021

58.460.662.2
Percentage point change in employment–population ratios for Asian groups, 2020 to 2021
CharacteristicChange from 2020 to 202120202021

Total

3.357.360.6

Men

2.965.468.3

Women

3.750.253.9

Age

Ages 16 to 24

4.033.437.4

Ages 25 to 54

4.173.577.6

Age 55 and older

2.037.339.3

Country of birth

Foreign born

3.957.060.9

Native born

1.857.559.3
Percent distribution of the Asian population age 16 and older by detailed groups, 2021
Asian groupPercent distribution

Asian Indian

22.9%

Chinese

22.1

Other Asian

17.7

Filipino

14.9

Vietnamese

10.1

Korean

7.2

Japanese

5.0
Employment–population ratios of detailed Asian groups, 2019–21
Year201920202021

Asian Indian

66.6%63.2%66.6%

Filipino

63.955.860.6

Vietnamese

61.252.059.1

Other Asian

61.156.559.7

Chinese

60.456.659.7

Korean

60.355.654.4

Japanese

56.153.853.1

A Blueprint for Modernizing the Consumer Price Index

At BLS, we never stop improving. We highly value any input from our data users, technical advisors, and other experts that helps us improve our high quality economic statistics. On May 3, 2022, we welcomed the latest evaluation of one of our statistical programs from the National Academy of Sciences, Committee on National Statistics (CNSTAT): Modernizing the Consumer Price Index for the 21st Century.

As we first reported in December 2019, CNSTAT convened an expert panel to study the Consumer Price Index (CPI). In our update in August 2021, we shared the panel membership and described the public meetings where the panel gathered information for its report. Now that the panel has completed its report, we share our plans to address their recommendations:

  • Adopt an alternative data strategy that significantly expands the use of new data sources and collection methods.
  • Improve the timeliness and quality of market basket weights in the CPI.
  • Continue research to enhance and inform the public’s understanding of consumer price change for shelter and medical care.
  • Calculate income-based CPIs and address methodology limitations.
  • Collaborate across the federal and international statistical system.

Use Alternative Data Sources

The chapter on modernizing elementary indexes focused on alternative data sources. Using data from sources beyond traditional surveys is a theme throughout the report. The recommendation to develop a household scanner data program would be a long-term strategy to address many challenges of calculating an accurate and timely CPI. BLS agrees with the panel to seek new data sources to improve every aspect of price index calculation: prices, expenditures (including the quantities purchased), quality adjustment, modeling, estimation, and imputation. Doing so will enable BLS to improve and expand the data we produce and provide users the data they need when they need it.

Even before the CNSTAT report, BLS has been busy building a pipeline of alternative data sources and improving our estimation methods for the CPI. Increasing the focus on alternative data should generate a steady flow of new data sources. This focus also will improve our ability to collect data through a variety of methods and give us new opportunities to address quality change. Consistent with our values to provide accessible information, we will keep you informed about new data sources and methods through the BLS website.

Improve Timeliness and Quality of Market Basket Weights

Beginning in January 2023, BLS plans to update market basket weights in the CPI annually, using 1 year of data. This change will immediately improve the timeliness of the market basket. BLS will continue our efforts to collect and process data more quickly to calculate the CPI using the most recent spending information.

BLS uses several data sources to adjust data collected in the Consumer Expenditure Surveys to calculate the CPI market basket weights. BLS will analyze the feasibility of using business data from the Bureau of Economic Analysis to adjust for categories consumers are reluctant to report, such as alcohol and tobacco. BLS plans to research alternative data sources to improve expenditure estimates when information from respondents is missing or aggregated.

BLS continues to believe collecting data directly from consumers is important to achieve our measurement objective. We are conducting research on a Household Cost Index, which requires household-level expenditure estimates to calculate household-specific indexes. As the panel notes, indexes for specific populations also require linking expenditures with information about households. Given current resources, we do not plan to expand our use of data from other sources in the next few years to supplement data collected in the Consumer Expenditure Surveys. In the future, BLS could pursue a household scanner data program to address the concerns the panel raises regarding the Consumer Expenditure Surveys.

Modernize Shelter

BLS is exploring alternative data sources to supplement rents collected in our housing survey and improve imputation of rental equivalence estimates for owner-occupied housing . We will continue to produce research indexes that meet user needs. BLS plans to publish research on a rent index focused on new tenants. Future research will target alternatives to rent data as a proxy for rental equivalence in predominantly owner-occupied areas and alternatives to the rental equivalence approach for high-end properties.

All BLS consumer indexes currently use a rental equivalence approach to target a cost-of-living measurement objective. Research indexes based on occupancy (renter and owner) will provide users with more insight. Some users need indexes for certain populations. As already mentioned, BLS will continue to research a Household Cost Index that uses a payments approach for owner-occupied housing. Some of these research indexes may ultimately be “promoted” to official status.

Modernize Medical Care

BLS uses an indirect method to price health insurance because directly pricing health insurance premiums is difficult. We have confirmed the retained earnings data incorporate rebates and will pursue further improvements to the indirect approach. We are pursuing implementation of claims data for physician’s and hospital outpatient services and will monitor hospital price transparency data as a possible data source in the future. Research comparing the indirect and direct methods is well underway and will be published initially as a research paper.

Calculate Supplemental Population Price Indexes

BLS continues research on producing price indexes by income groups. While BLS recognizes the limited benefit of reweighting the market basket to create indexes for particular population groups, we believe indexes for renters and owners will provide more insight into measuring price change for shelter. BLS will continue to seek cost-effective methods to study household behaviors and seek resources to collect household scanner data linked with demographics.

Collaborate with Other Statistical Organizations

Another theme throughout the report is communication and collaboration among statistical agencies. The panel recommended expanding collaboration, especially in research and data sharing. As the complexity of data sources and methods increases, BLS also needs to communicate with stakeholders to maintain transparency. Our practice is to announce on the BLS website in advance any changes to our data sources or methods. We will continue to share research index results to document the impact of these changes. BLS is looking into new ways of sharing data and improving transparency.

We value our partnerships with other agencies in the federal and international statistical community. In June 2022, we will share the CNSTAT recommendations with the Federal Economic Statistics Advisory Committee and discuss our plans. We will continue to seek out new opportunities to connect and collaborate with colleagues in the government, academic, and private sectors as we improve our statistics. We also will ensure our staff has the skills to innovate the modern methods of the future. In the last few years, BLS developed an in-house Data Science Training Program designed to bring awareness and improve the skills of BLS staff in key areas of data science. This annual program introduces a new cohort of BLS staff to these concepts, with plans to scale for larger cohorts in the future and include more specialized learning streams.

It is an exciting time to produce economic statistics. Their importance is paramount, and the opportunities have expanded to improve their accuracy, relevance, and timeliness. The CNSTAT’s latest report on the CPI is a valuable guide to help us keep improving and continue to produce gold standard data well into the future.

Measuring Changes in Shelter Prices in the Consumer Price Index

Shelter costs are the largest regular expense for most households. That makes them a topic of considerable interest to users of Consumer Price Index (CPI) data. The U.S. city average for shelter increased 5.1 percent from April 2021 to April 2022. Its two main components, owners’ equivalent rent of residences and rent of primary residence, each increased 4.8 over the year. (Lodging away from home is the other component of shelter, and lodging prices rose 19.7 percent from April 2021 to April 2022.)

Consumer Price Index for All Urban Consumers, all items and shelter, January 2012 to April 2022

Editor’s note: Data for this chart are available in the table below.

Because of their large weight in the CPI market basket—nearly a third—the indexes for owners’ equivalent rent and rent can have a large impact on the overall inflation estimate. There is also a lot of misunderstanding about these shelter indexes, and so it is worth taking a few minutes to get a clear understanding of what they measure.

Owners’ equivalent rent is the larger of these two components, at nearly one quarter of the consumer market basket, or weight, in the CPI. It represents the implicit amount an owner of a housing unit would have to pay in rent to live in the unit, assuming it was leased instead of owned. The expenditure weight for owners’ equivalent rent in the CPI is based on a question in the Consumer Expenditure Survey. That question asks homeowners, “If someone were to rent your home today, how much do you think it would rent for monthly, unfurnished and without utilities?” The role of this question can be easily misunderstood by even sophisticated users of BLS data. That has contributed to a common misconception: the mistaken belief that the price observations used for owners’ equivalent rent in the CPI are also from homeowner estimates of their home’s rental value. In fact, the sample of prices used in the owners’ equivalent rent index comes from observations of rent collected in our monthly survey of housing prices, but with utilities and other similar charges removed.

Why don’t we just measure changes in home values in the CPI? It’s because a home isn’t just a consumption item for the owner. It is also an investment, often the largest investment many people will make in their lives. The concept in the CPI—and in the economic statistics programs of most other nations—is to treat owned housing as a capital or investment good, distinct from the shelter service it provides. We treat spending to buy and improve houses and other housing units as investment and not consumption in the CPI. Mortgage interest costs, property taxes, real estate fees, most maintenance, and all improvement costs are part of the cost of the capital good and are also not treated as consumption items. These nonconsumption costs of owned housing are out of scope for the CPI under the cost-of-living framework that guides the index.

Some people have noted that the CPI index for rent (which represents just over 7 percent of the weight of the CPI) is not rising as fast as some other measures, notably those published by firms in the real estate industry. One reason for this is that over 80 percent of rental units in the CPI sample each period have tenants who continue to rent the same unit. Landlords often raise rents when a unit is vacated by a prior tenant and a new tenant moves in. In some cases, the rent paid by tenants with multi-year leases increases periodically—and automatically, by the CPI itself—through an escalation clause in the lease agreement that cites the CPI for this purpose.

Because rents for existing tenants change in line with the terms of leases and rental agreements, and many leases are for 12 months, existing tenants typically do not face price change within the 12-month period of the lease. This is called a “sticky” price. Because of this, the process used to calculate the indexes for rent and owners’ equivalent rent differs from the process used to calculate the rest of the CPI. Most prices are collected either monthly or every 2 months, but rent prices are collected every 6 months. In effect, this means price increases for shelter can sometimes take longer to appear in the CPI than in some other data sources.

We are always working to improve the accuracy of the CPI, and that includes our shelter indexes. We asked for expert opinion from the National Academy of Sciences, Committee on National Statistics, on better ways to measure price change for these important items. The committee recently published their report, “Modernizing the Consumer Price Index for the 21st Century.” The report endorsed the use of owners’ equivalent rent in the CPI and recommended that, “BLS should continue using rental equivalence as the primary approach to estimating the price of housing services for owner-occupied units.”

I will say more about the report from the Committee on National Statistics soon. In the meantime, we will consider all the recommendations of this distinguished group as we plan future improvements to the CPI.

You can read more about shelter in our factsheet for rent and owners’ equivalent rent. We also have more technical details in the Handbook of Methods.

Consumer Price Index for All Urban Consumers, all items and shelter, January 2012 to April 2022
MonthAll itemsShelterRent of primary residenceOwners’ equivalent rent of residences

Jan 2012

100.000100.000100.000100.000

Feb 2012

100.440100.205100.182100.102

Mar 2012

101.203100.472100.332100.295

Apr 2012

101.509100.638100.469100.465

May 2012

101.390100.799100.589100.560

Jun 2012

101.241100.999100.657100.660

Jul 2012

101.076101.179100.929100.837

Aug 2012

101.639101.350101.150101.097

Sep 2012

102.092101.511101.438101.322

Oct 2012

102.052101.737101.937101.538

Nov 2012

101.569101.804102.193101.735

Dec 2012

101.295101.922102.477101.880

Jan 2013

101.595102.213102.711102.077

Feb 2013

102.427102.481102.926102.249

Mar 2013

102.695102.720103.146102.384

Apr 2013

102.588102.848103.209102.542

May 2013

102.771103.097103.432102.701

Jun 2013

103.017103.340103.566102.888

Jul 2013

103.058103.554103.790103.045

Aug 2013

103.182103.779104.187103.355

Sep 2013

103.302103.905104.432103.570

Oct 2013

103.036104.053104.752103.839

Nov 2013

102.825104.285105.038104.149

Dec 2013

102.816104.509105.422104.415

Jan 2014

103.199104.852105.666104.646

Feb 2014

103.581105.113105.828104.815

Mar 2014

104.248105.512106.120105.056

Apr 2014

104.591105.696106.358105.227

May 2014

104.957106.036106.595105.411

Jun 2014

105.152106.252106.832105.604

Jul 2014

105.111106.567107.192105.844

Aug 2014

104.935106.787107.502106.124

Sep 2014

105.014106.979107.871106.380

Oct 2014

104.751107.224108.254106.667

Nov 2014

104.185107.399108.695106.969

Dec 2014

103.594107.543108.987107.140

Jan 2015

103.107107.932109.258107.403

Feb 2015

103.555108.247109.575107.632

Mar 2015

104.171108.628109.862107.885

Apr 2015

104.383108.871110.044108.142

May 2015

104.915109.101110.295108.353

Jun 2015

105.282109.454110.600108.720

Jul 2015

105.289109.886111.011109.018

Aug 2015

105.140110.096111.390109.325

Sep 2015

104.977110.379111.871109.664

Oct 2015

104.929110.648112.306109.963

Nov 2015

104.708110.818112.653110.260

Dec 2015

104.350111.000112.995110.509

Jan 2016

104.523111.434113.305110.795

Feb 2016

104.609111.802113.605111.031

Mar 2016

105.059112.101113.882111.250

Apr 2016

105.557112.353114.148111.546

May 2016

105.984112.781114.482111.890

Jun 2016

106.332113.231114.818112.249

Jul 2016

106.160113.510115.190112.574

Aug 2016

106.258113.834115.599112.942

Sep 2016

106.513114.165116.005113.367

Oct 2016

106.646114.543116.563113.751

Nov 2016

106.480114.757117.024114.167

Dec 2016

106.515115.016117.469114.458

Jan 2017

107.136115.389117.753114.717

Feb 2017

107.473115.736118.042114.947

Mar 2017

107.560115.972118.297115.127

Apr 2017

107.879116.233118.533115.321

May 2017

107.971116.546118.883115.529

Jun 2017

108.069116.916119.246115.874

Jul 2017

107.995117.102119.579116.186

Aug 2017

108.318117.589120.086116.629

Sep 2017

108.892117.859120.392116.974

Oct 2017

108.823118.253120.871117.386

Nov 2017

108.825118.386121.324117.733

Dec 2017

108.761118.701121.803118.092

Jan 2018

109.354119.071122.146118.391

Feb 2018

109.850119.356122.336118.563

Mar 2018

110.098119.826122.571118.878

Apr 2018

110.536120.167122.913119.194

May 2018

110.996120.638123.195119.468

Jun 2018

111.172120.877123.516119.779

Jul 2018

111.180121.219123.917120.129

Aug 2018

111.242121.574124.421120.514

Sep 2018

111.371121.734124.763120.799

Oct 2018

111.568122.001125.188121.205

Nov 2018

111.194122.224125.708121.633

Dec 2018

110.839122.500126.037121.899

Jan 2019

111.050122.911126.340122.185

Feb 2019

111.520123.376126.633122.505

Mar 2019

112.149123.869127.084122.830

Apr 2019

112.743124.313127.536123.190

May 2019

112.983124.676127.790123.463

Jun 2019

113.005125.113128.300123.861

Jul 2019

113.194125.442128.672124.179

Aug 2019

113.188125.656129.073124.542

Sep 2019

113.277126.005129.537124.906

Oct 2019

113.536126.081129.865125.222

Nov 2019

113.475126.280130.307125.597

Dec 2019

113.372126.476130.683125.894

Jan 2020

113.812126.982131.085126.273

Feb 2020

114.123127.454131.392126.523

Mar 2020

113.875127.596131.743126.785

Apr 2020

113.114127.559131.982126.973

May 2020

113.116127.851132.244127.237

Jun 2020

113.735128.067132.431127.379

Jul 2020

114.310128.368132.686127.653

Aug 2020

114.671128.532132.878127.889

Sep 2020

114.830128.579133.058128.015

Oct 2020

114.878128.640133.332128.347

Nov 2020

114.808128.704133.496128.454

Dec 2020

114.916128.809133.658128.625

Jan 2021

115.405129.037133.775128.810

Feb 2021

116.036129.321133.963129.090

Mar 2021

116.858129.760134.148129.337

Apr 2021

117.819130.245134.361129.564

May 2021

118.763130.677134.652129.920

Jun 2021

119.867131.372134.969130.363

Jul 2021

120.443131.997135.215130.757

Aug 2021

120.692132.182135.697131.151

Sep 2021

121.020132.641136.296131.721

Oct 2021

122.025133.121136.932132.368

Nov 2021

122.625133.642137.566132.989

Dec 2021

123.002134.131138.111133.505

Jan 2022

124.037134.667138.812134.075

Feb 2022

125.170135.454139.545134.649

Mar 2022

126.841136.244140.110135.204

Apr 2022

127.549136.941140.835135.764

Measuring Consumer Prices for New Vehicles More Accurately

In May 2020, we announced a new research index designed to improve the way we measure consumer price changes for new vehicles. Part of the Consumer Price Index (CPI) program, the research index uses transaction data on vehicle purchases. BLS obtains the data from J.D. Power. After carefully studying the data, we now plan to implement the new data source into the official CPI, effective with the April 2022 release, which we will publish on May 11, 2022. We also will update Measuring Price Change in the CPI: New vehicles factsheet at that time.

The research index departs from the traditional survey methods and data sources we have used in the CPI. The traditional methods sample vehicle dealers and the makes, models, and features of the vehicles they sell. That’s why we took a very deliberate approach before we incorporated the new data into the official CPI. We discuss details of our methods and research in “A New Vehicles Transaction Price Index: Offsetting the Effects of Price Discrimination and Product Cycle Bias with a Year-Over-Year Index.”

Leading up to March 2020, the movements of the research index for new vehicles were similar to the official index for new vehicles. Since March 2020, the indexes began to diverge, with the research index showing faster price increases that the official index did not reflect.

Editor’s note: Data for this chart are available in the table below.

Since the COVID-19 pandemic began in March 2020, the economy experienced significant disruption. This is especially true of the automobile industry, which saw fluctuations in the supply chain, employment, and consumer demand. Combining these shifts in the economy with the changes in methods represented by the research index made it challenging to assess our results.

While the research index and the official new vehicles index maintained similar trends, the recent divergence between them provided an opportunity to assess the robustness of the two approaches.

We weighed several factors in deciding whether to incorporate the J.D Power data on new vehicle prices into the official CPI. The new data include records of the prices paid during hundreds of thousands of transactions each month. That dwarfs the roughly 500 prices collected using traditional CPI methods. The larger dataset allows us to estimate price changes more precisely. As a result, the research index has a much lower standard error than the official new vehicles index.

Editor’s note: Data for this chart are available in the table below.

Because the research data reflect actual transactions, the shift in consumer preference from cars to other types of vehicles, such as trucks, is built into the data. This differs from the official index, which has maintained a roughly equal weight between cars and trucks.

In addition to the quantitative evaluations, BLS continued to ask for feedback on the research index through our website and by consulting with other statistical agencies. We received positive feedback and no major concerns, and we remain confident the research index is statistically sound. For these reasons, we have decided to incorporate the new data source and methods for new vehicles in the official CPI.

In some ways, the past 2 years have been an unprecedented time for statistical measurement, but in other ways business at BLS has continued as usual. When the COVID-19 pandemic began in March 2020, BLS ceased in-person data collection for the CPI and other programs. We collected more data online, by telephone, and through video. While the pandemic affected data collection, we continue to publish data on schedule. We also continue to assess our methods and seek ways to improve the quality of our data. Improving our methods for collecting price data for new vehicles is another step forward in innovating and improving the CPI.

Comparison of research index and official index for new vehicle prices
MonthResearch indexOfficial index

Jan 2018

100.000100.000

Feb 2018

100.02699.871

Mar 2018

99.48199.817

Apr 2018

99.84299.370

May 2018

99.58399.560

Jun 2018

99.49999.705

Jul 2018

99.84199.681

Aug 2018

99.94299.424

Sep 2018

99.91799.129

Oct 2018

99.88699.043

Nov 2018

100.07299.204

Dec 2018

99.47199.409

Jan 2019

99.969100.043

Feb 2019

100.295100.157

Mar 2019

100.182100.539

Apr 2019

100.487100.574

May 2019

100.659100.452

Jun 2019

100.362100.287

Jul 2019

100.484100.027

Aug 2019

100.08999.633

Sep 2019

100.20399.224

Oct 2019

100.44399.136

Nov 2019

99.96599.138

Dec 2019

99.91299.472

Jan 2020

100.486100.175

Feb 2020

100.843100.549

Mar 2020

101.301100.087

Apr 2020

102.431100.008

May 2020

102.842100.154

Jun 2020

103.653100.076

Jul 2020

104.047100.549

Aug 2020

104.142100.284

Sep 2020

103.895100.249

Oct 2020

103.841100.653

Nov 2020

103.977100.726

Dec 2020

103.781101.425

Jan 2021

104.818101.620

Feb 2021

105.652101.714

Mar 2021

106.308101.582

Apr 2021

107.156101.971

May 2021

111.189103.502

Jun 2021

113.656105.341

Jul 2021

114.795106.944

Aug 2021

115.205107.930

Sep 2021

115.942109.013

Oct 2021

118.107110.566

Nov 2021

118.980111.915

Dec 2021

120.336113.373

Jan 2022

121.230114.005

Feb 2022

122.481114.308
Comparison of 12-month standard errors for the research index and official index for new vehicle prices
MonthResearch indexOfficial index

Jan 2019

0.110.61

Feb 2019

0.100.58

Mar 2019

0.110.42

Apr 2019

0.110.43

May 2019

0.130.43

Jun 2019

0.120.46

Jul 2019

0.140.43

Aug 2019

0.130.42

Sep 2019

0.140.42

Oct 2019

0.120.45

Nov 2019

0.160.46

Dec 2019

0.160.40

Jan 2020

0.150.41

Feb 2020

0.150.38

Mar 2020

0.140.33

Apr 2020

0.150.36

May 2020

0.130.40

Jun 2020

0.130.36

Jul 2020

0.150.48

Aug 2020

0.140.47

Sep 2020

0.130.60

Oct 2020

0.130.64

Nov 2020

0.120.65

Dec 2020

0.120.62

Jan 2021

0.130.62

Feb 2021

0.130.66

Mar 2021

0.120.67

Apr 2021

0.110.60

May 2021

0.120.59

Jun 2021

0.130.63

Jul 2021

0.130.61

Aug 2021

0.130.69

Sep 2021

0.130.74

Oct 2021

0.160.72

Nov 2021

0.150.55

Dec 2021

0.150.69

Jan 2022

0.140.67

Feb 2022

0.140.68