
An official website of the United States government
An official website of the United States government
The .gov means it's official.
Federal government websites often end in .gov or .mil. Before sharing sensitive information,
make sure you're on a federal government site.
The site is secure.
The
https:// ensures that you are connecting to the official website and that any
information you provide is encrypted and transmitted securely.
The Quarterly Census of Employment and Wages (QCEW) program publishes a quarterly count of employment and wages reported by employers covering more than 95 percent of U.S. jobs, available at the county, MSA, state and national levels by industry.
Percent change in employment, average weekly wages, and establishments in 10 largest counties, total covered employment, December 2020 to December 2021
County
Percent change in employment
Percent change in establishments
Percent change in average weekly wages
Los Angeles, CA
8.2%
2.6%
5.4%
Cook, IL
5.3%
2.3%
6.4%
New York, NY
7.9%
-3.9%
6.6%
Harris, TX
5.2%
2.8%
5.9%
Maricopa, AZ
4.6%
8.6%
5.6%
Dallas, TX
5.8%
3.8%
5.6%
Orange, CA
7.4%
4.2%
2.8%
San Diego, CA
8.6%
3.3%
2.7%
King, WA
6.4%
-8.5%
7.3%
Miami-Dade, FL
7.5%
8.4%
11.4%
U.S. TOTAL
+5.2%(p) since Dec 2020
![]()
Los Angeles County, California
+8.2%(p) since Dec 2020
![]()
Cook County, Illinois
+5.3%(p) since Dec 2020
![]()
New York County, New York
+7.9%(p) since Dec 2020
![]()
Harris County, Texas
+5.2%(p) since Dec 2020
![]()
Maricopa County, Arizona
+4.6%(p) since Dec 2020
![]()
Dallas County, Texas
+5.8%(p) since Dec 2020
![]()
Orange County, California
+7.4%(p) since Dec 2020
![]()
San Diego County, California
+8.6%(p) since Dec 2020
![]()
King County, Washington
+6.4%(p) since Dec 2020
![]()
Miami-Dade County, Florida
+7.5%(p) since Dec 2020
![]()
U.S. TOTAL
+5.9%(p) since 4th Qtr of 2020
![]()
Los Angeles County, California
+5.4%(p) since 4th Qtr of 2020
![]()
Cook County, Illinois
+6.4%(p) since 4th Qtr of 2020
![]()
New York County, New York
+6.6%(p) since 4th Qtr of 2020
![]()
Harris County, Texas
+5.9%(p) since 4th Qtr of 2020
![]()
Maricopa County, Arizona
+5.6%(p) since 4th Qtr of 2020
![]()
Dallas County, Texas
+5.6%(p) since 4th Qtr of 2020
![]()
Orange County, California
+2.8%(p) since 4th Qtr of 2020
![]()
San Diego County, California
+2.7%(p) since 4th Qtr of 2020
![]()
King County, Washington
+7.3%(p) since 4th Qtr of 2020
![]()
Miami-Dade County, Florida
+11.4%(p) since 4th Qtr of 2020
![]()
05/25/2022
From fourth quarter 2020 to fourth quarter 2021, Palm Beach, FL, had the largest county percentage increase in average weekly wages at 15.6 percent. Clark, NV, had the largest county over-the-year percentage increase in employment in December 2021 at 13.3 percent.
HTML
|
PDF
|
RSS
06/08/2022
BLS updated the full Quarterly Census of Employment and Wages (QCEW) database through the fourth quarter of 2021. Links to updated databases, files, and tables can be found at www.bls.gov/web/cewdat.supp.toc.htm.
HTML
|
PDF
|
RSS
|
Charts

Business dynamism refers to the continuous process of firm entry, growth, contraction, and exit, and the simultaneous creation and destruction of jobs. A healthy economy is marked by low barriers to entry for new firms and a labor market that permits workers to move easily between jobs. read more »
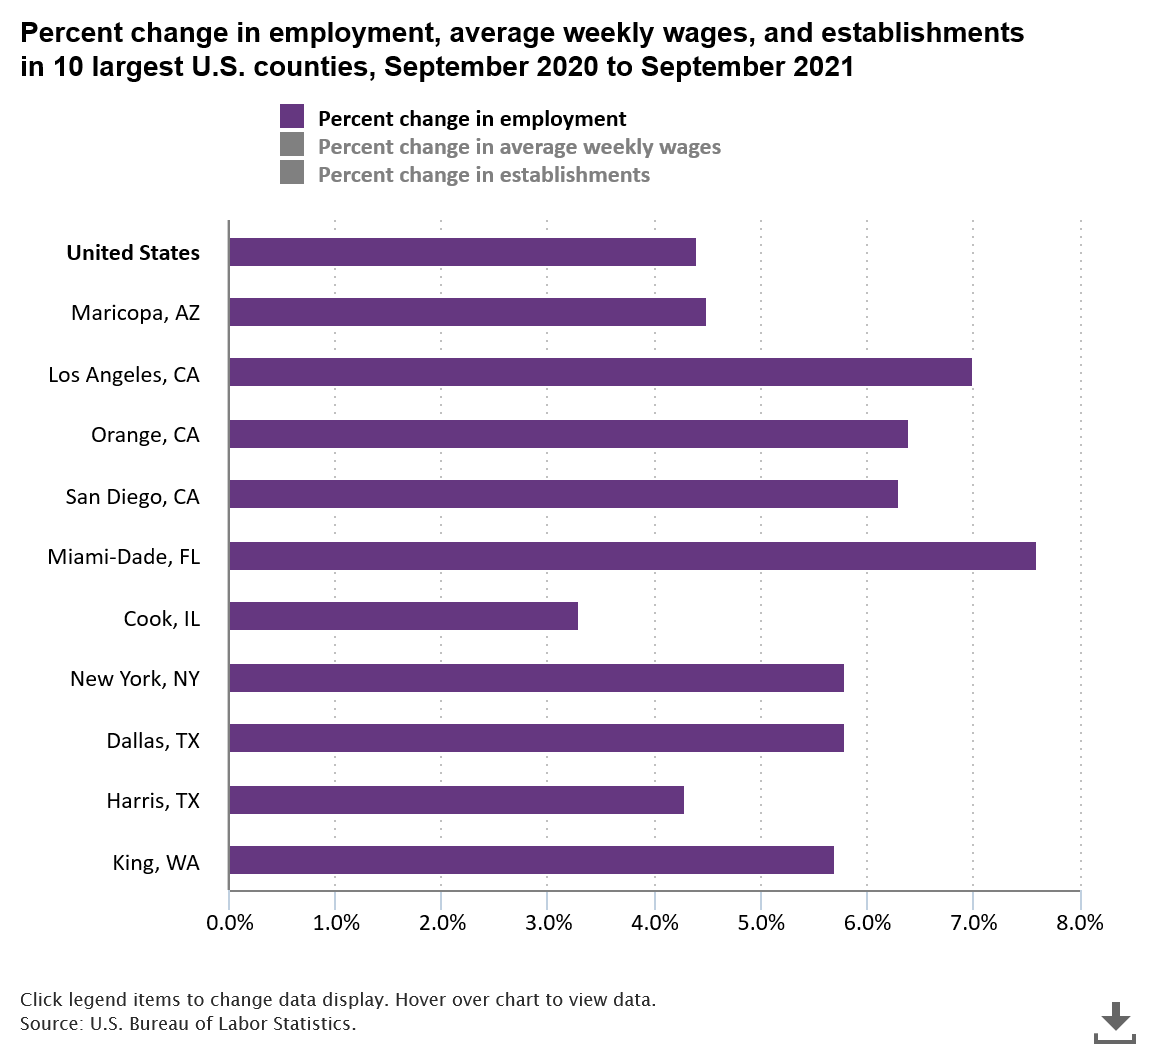
All of the 10 largest U.S. counties had over-the-year percentage increases in employment in September 2021 Miami-Dade, Florida, had the largest over-the-year employment percentage gain (+7.6 percent), followed by Los Angeles, California at 7.0 percent. Over-the-year change in employment at the national level was 4.4%. read more »