Performance insights: Get actionable insights on your website's performance
Published on
Developer advocate working on Chrome DevTools at Google.
Use the Performance insights panel to get actionable and use-case-driven insights on your website's performance.
This is a preview feature in Chrome 102. Our team is actively working on this feature and we are looking for your feedback for further enhancements.
Why a new panel?
The new Performance insights panel is an experiment to address these 3 developer pain points when working with the existing Performance panel:
- Too much information. With the redesigned UI, the Performance insights panel streamlines the data shown on screen, displaying only relevant information.
- Hard to distinguish between use cases. The Performance insights panel supports use-case-driven analysis. It only supports page load use-case at the moment, with more to come (e.g. interactivity) in the future based on your feedback.
- Requires deep expertise of how browsers work to use effectively. The Performance insights panel highlights the key insights in the Insights pane, with actionable feedback on how to fix it.
Introduction
This tutorial teaches you how to measure and understand your page load performance with the Performance insights panel. Read on, or watch the video version of this tutorial, above.
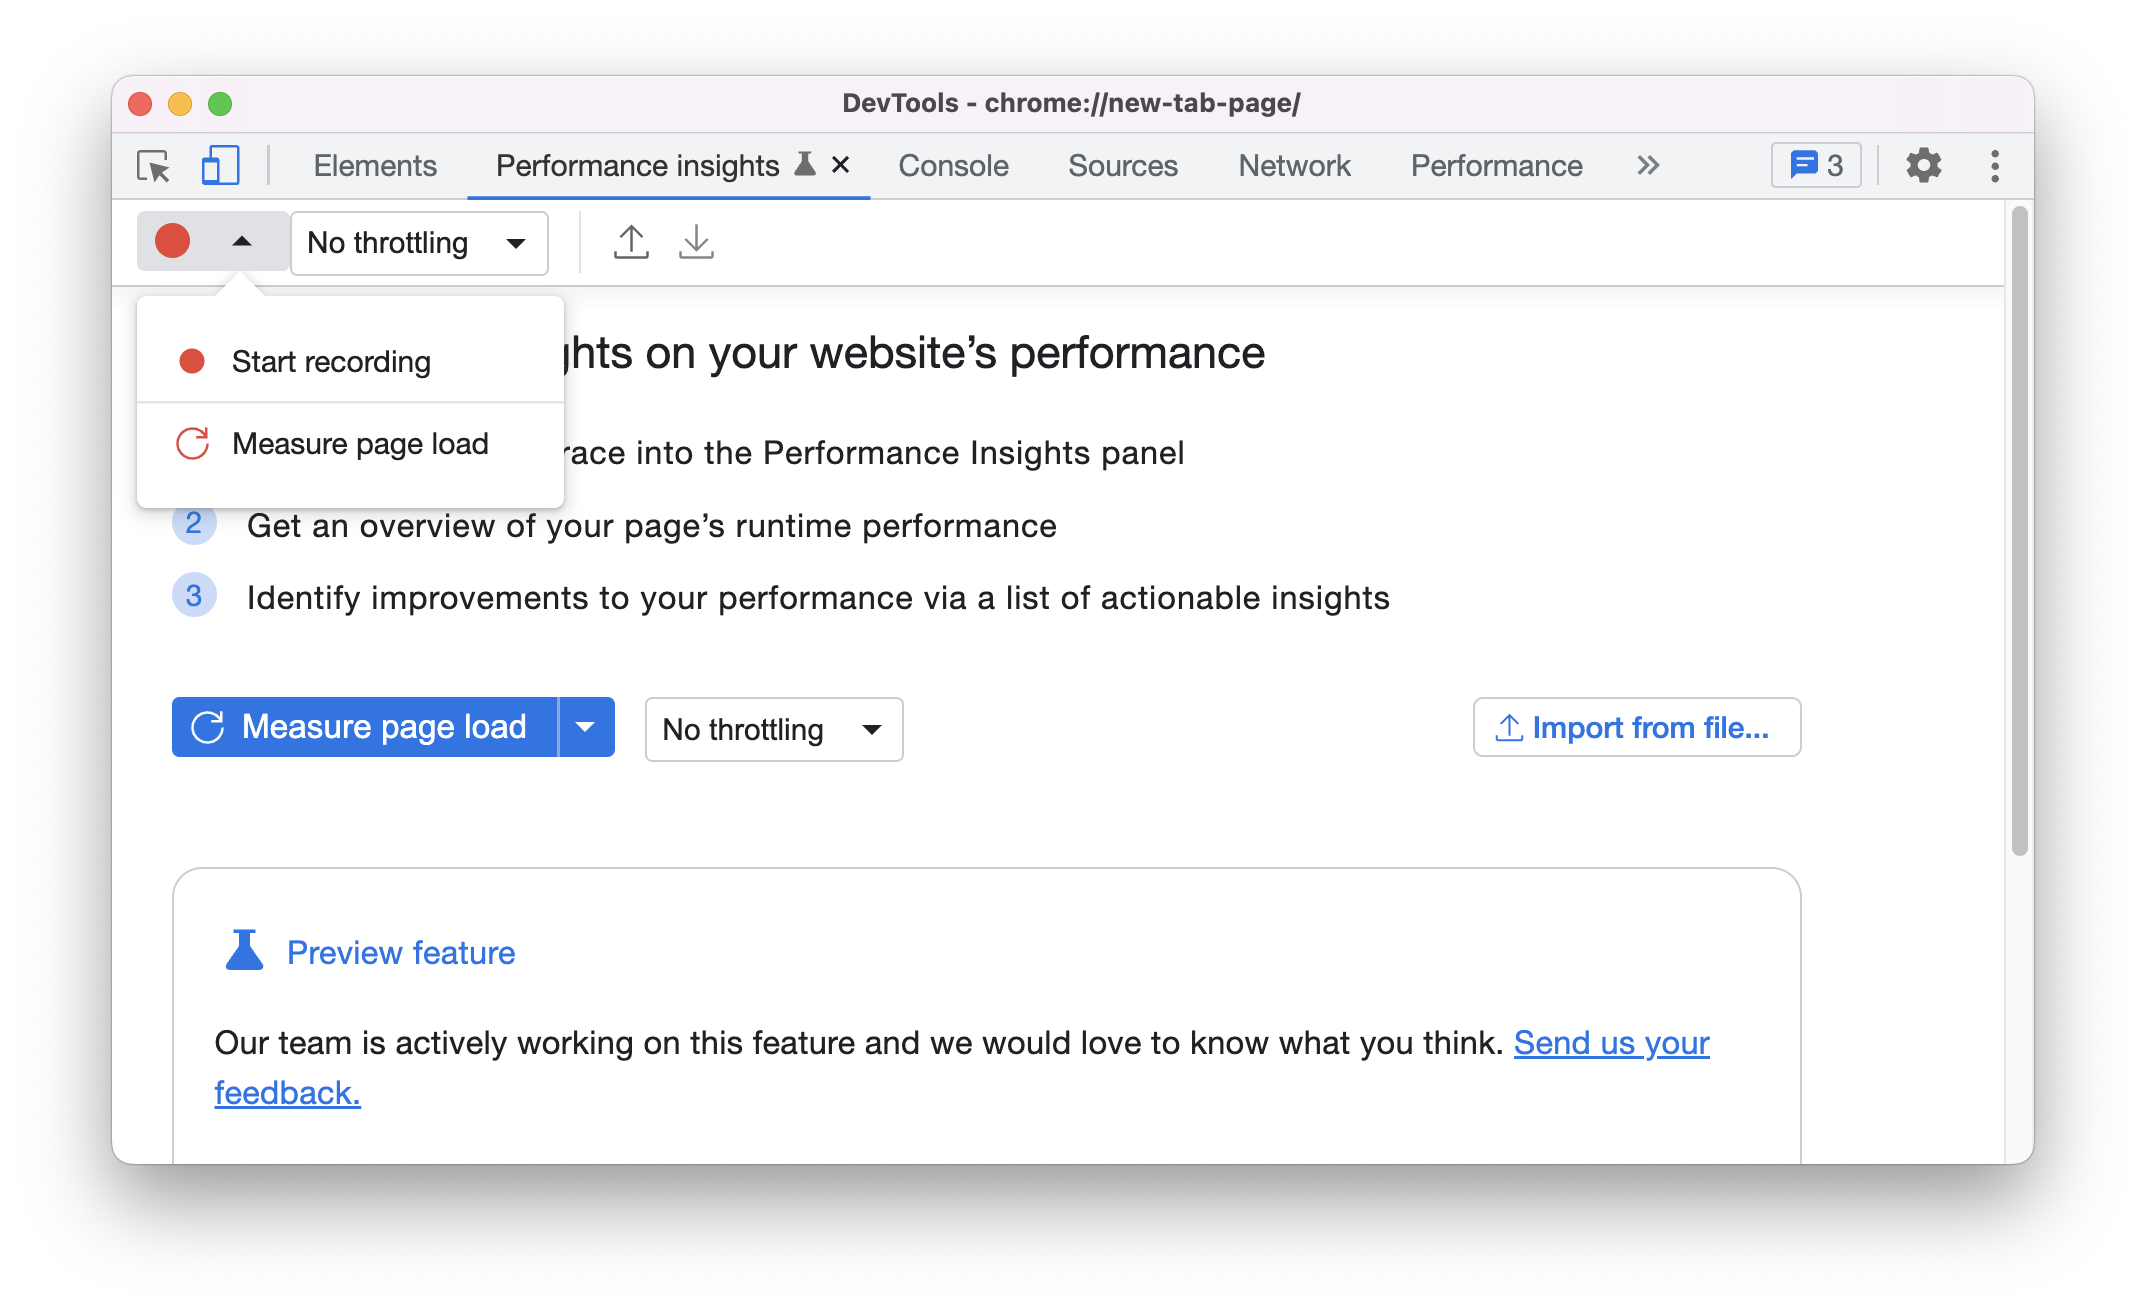
Open the Performance insights panel
Click on More options
 > More tools > Performance insights.
Alternatively, use the Command Menu to open the Performance insights panel.

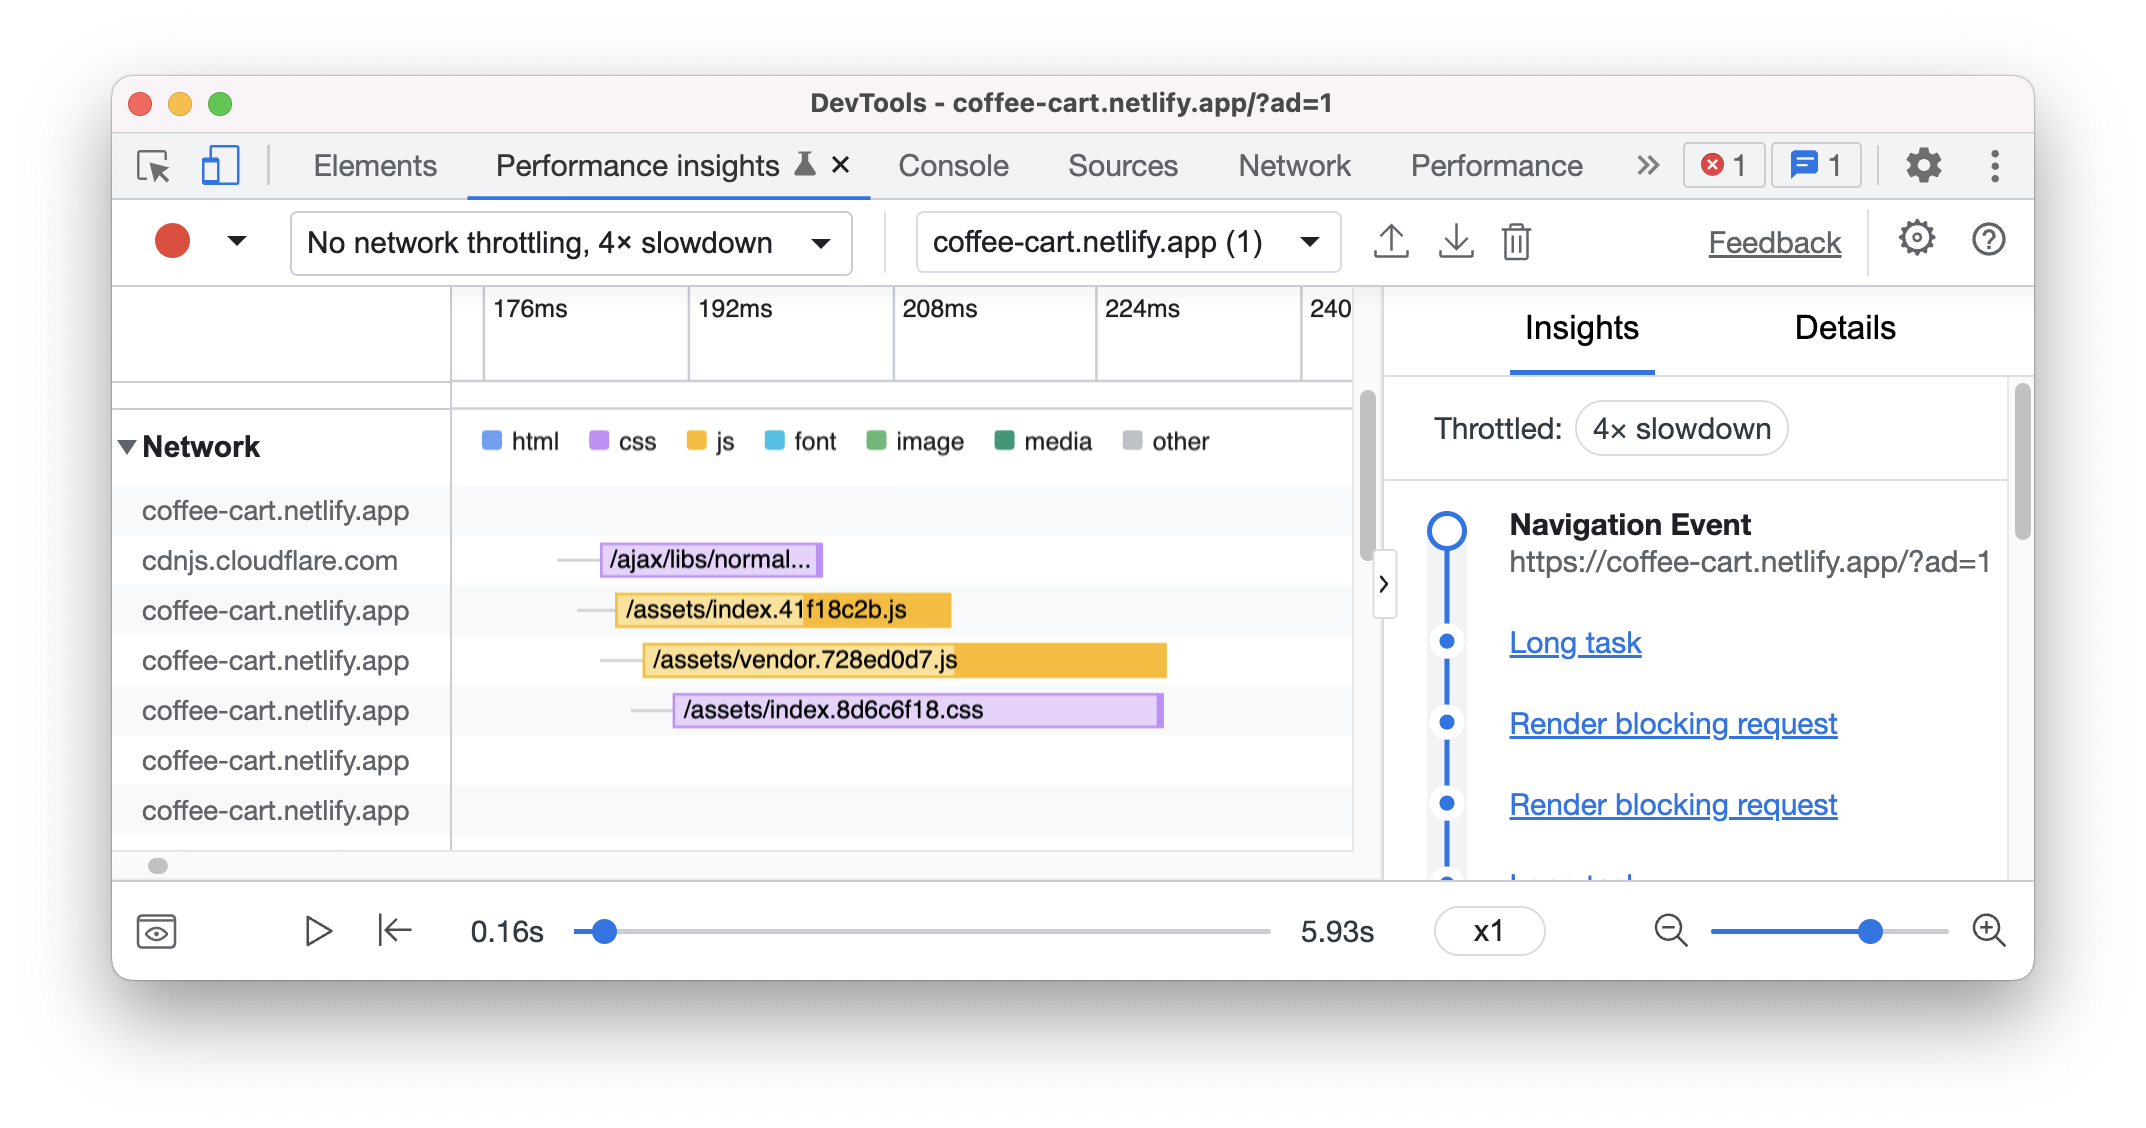
Record performance
The Performance insights panel supports record general and use-case-driven (e.g. page load) performance.
Click [Open Demo]. The demo opens in a new tab. Open Demo
You can throttle the network and CPU while recording. For the tutorial, let’s set disable cache and set CPU to 4x slowdown:
 Gotchas
Throttling is relative to your computer's capabilities. For example, the 4x slowdown option makes your CPU operate 4 times slower than its usual ability. DevTools can't truly simulate the CPUs of mobile devices, because the architecture of mobile devices is very different from that of desktops and laptops.
Click Measure page load. DevTools records performance metrics while the page reloads and then automatically stops the recording a couple seconds after the page load has finished.
 Gotchas
If you want to measure general performance of your web page, use Start recording. Interact with the page and click Stop recording manually to stop recording.
Replay a performance recording
Use the controls at the bottom to control the replay of your recording.

Here is an example of how to do it.
- Click Play to play the recording.
- Click Pause to pause the replay.
- Adjust the playback speed with the dropdown.
- Click Toggle visual preview to show or hide the visual preview.
Navigate a performance recording
DevTools automatically zooms out to show the full recording timeline. You can navigate the recording with zoom and move the timeline.
- Click on the Timeline to move the playhead to view a particular frame.
- Use the Zoom in and Zoom out control at the bottom to zoom.
- Drag the horizontal scroll bar at the bottom to move the timeline left and right.
- Alternatively, you can use keyboard shortcuts to zoom, move the timeline left and right. Click on the ? button to view the shortcuts.

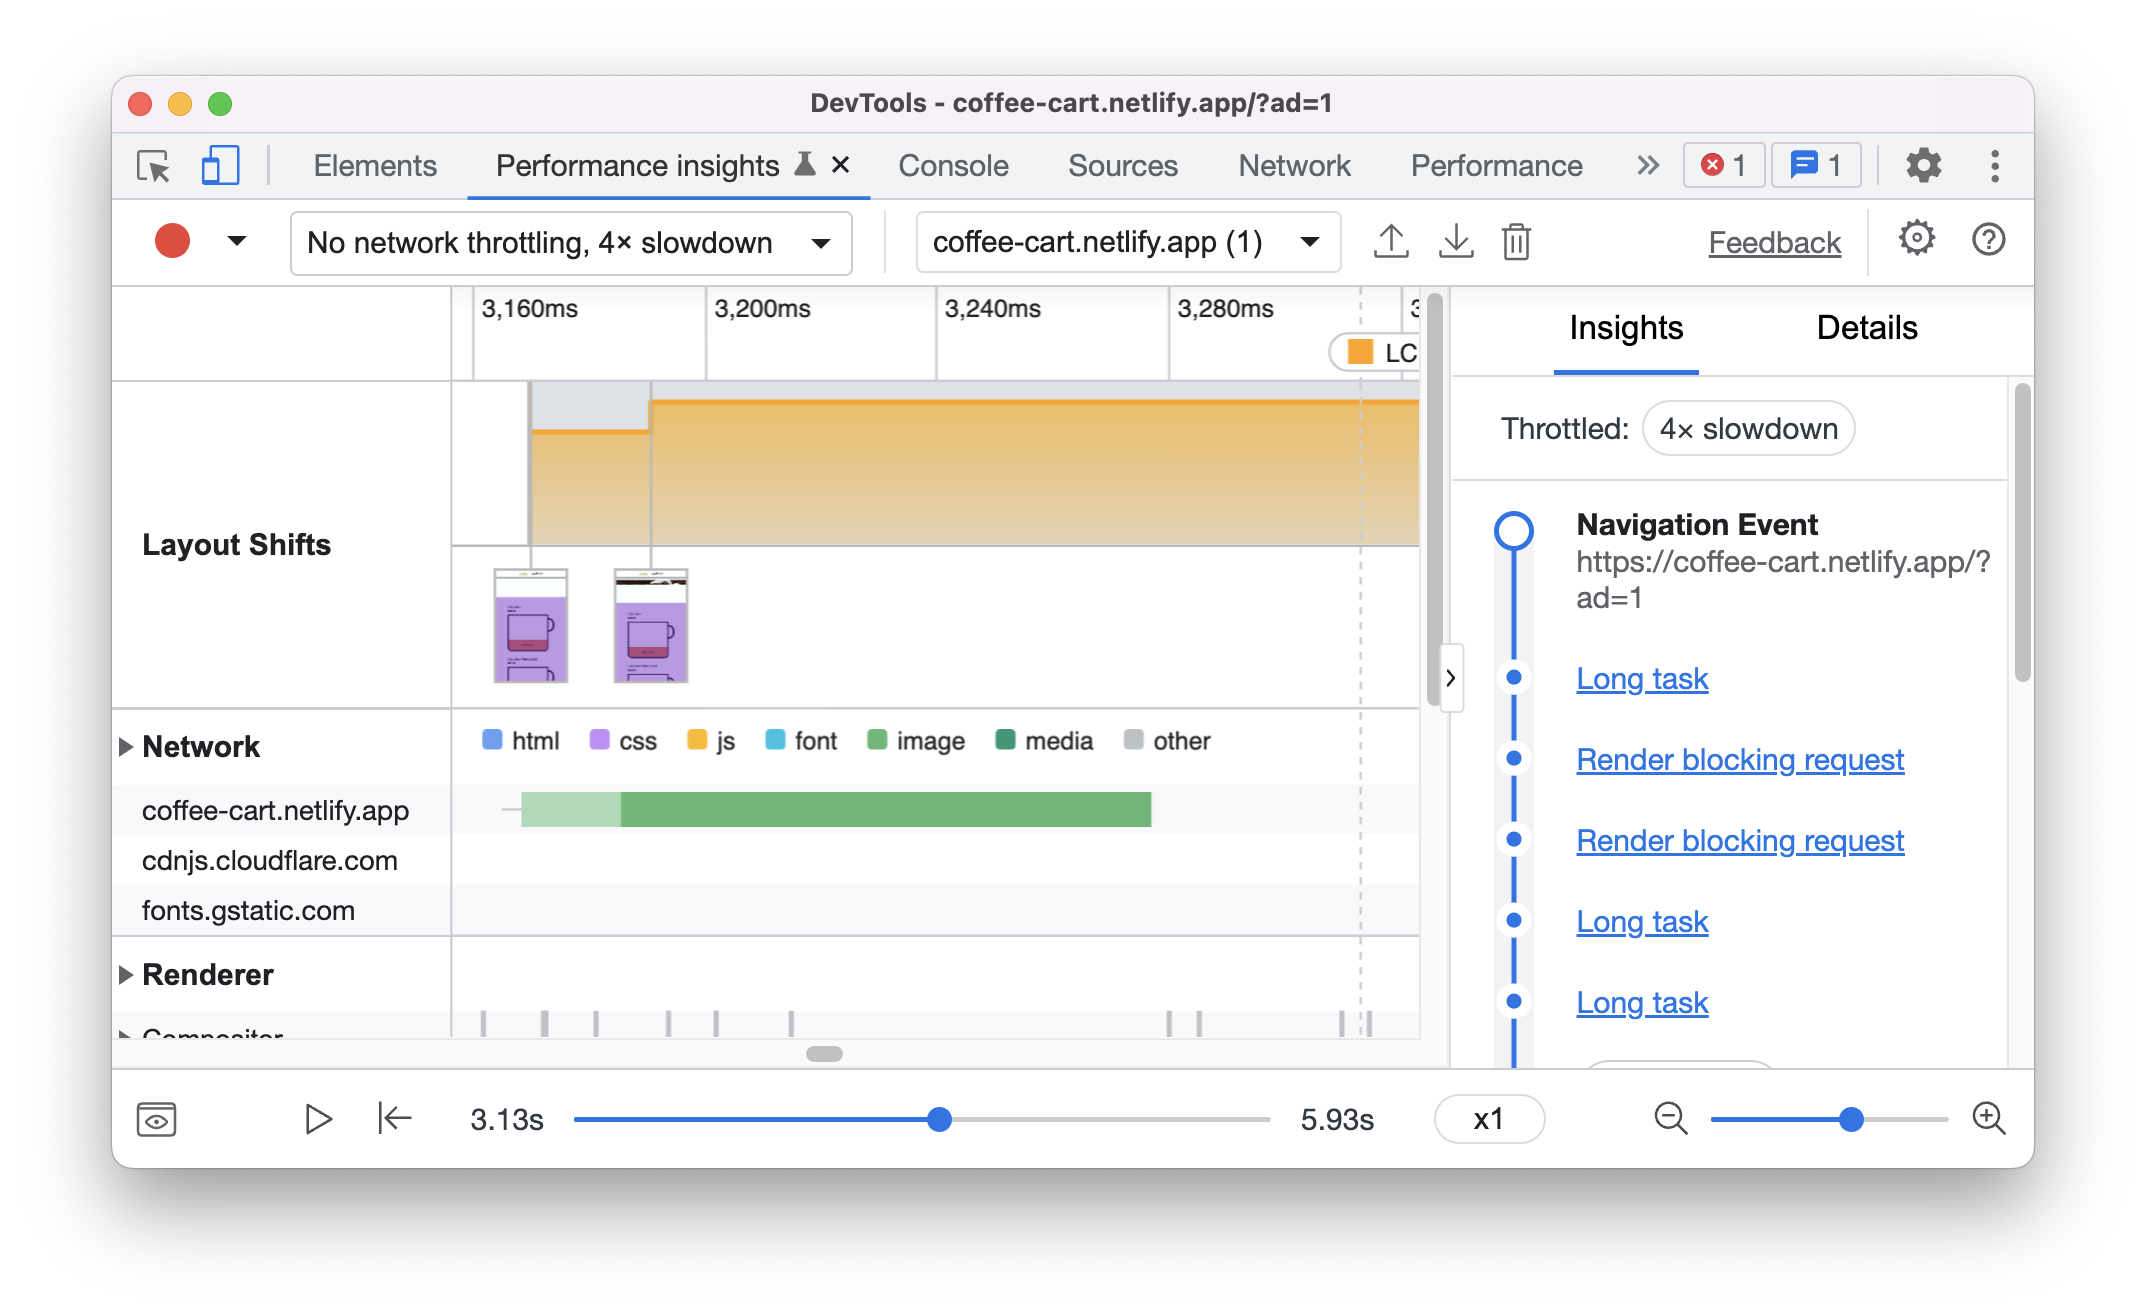
View performance insights
Get a list of performance insights in the Insights pane. Identify and fix potential performance issues.

Hover over each of the insights to highlight them on the main tracks.
Click on an insight (e.g. Rendering block request) to understand it further in the Details pane - source file, issue, how to fix it and more.

View Web Vitals performance metrics
Web Vitals is is an initiative by Google to provide unified guidance for quality signals that are essential to delivering a great user experience on the web.
You can view these metrics on the Timeline and Insights pane.

Hover over the insights on the Timeline to learn more about the metrics.
View layout shifts activity
View layout shifts activity in the Layout Shifts track.
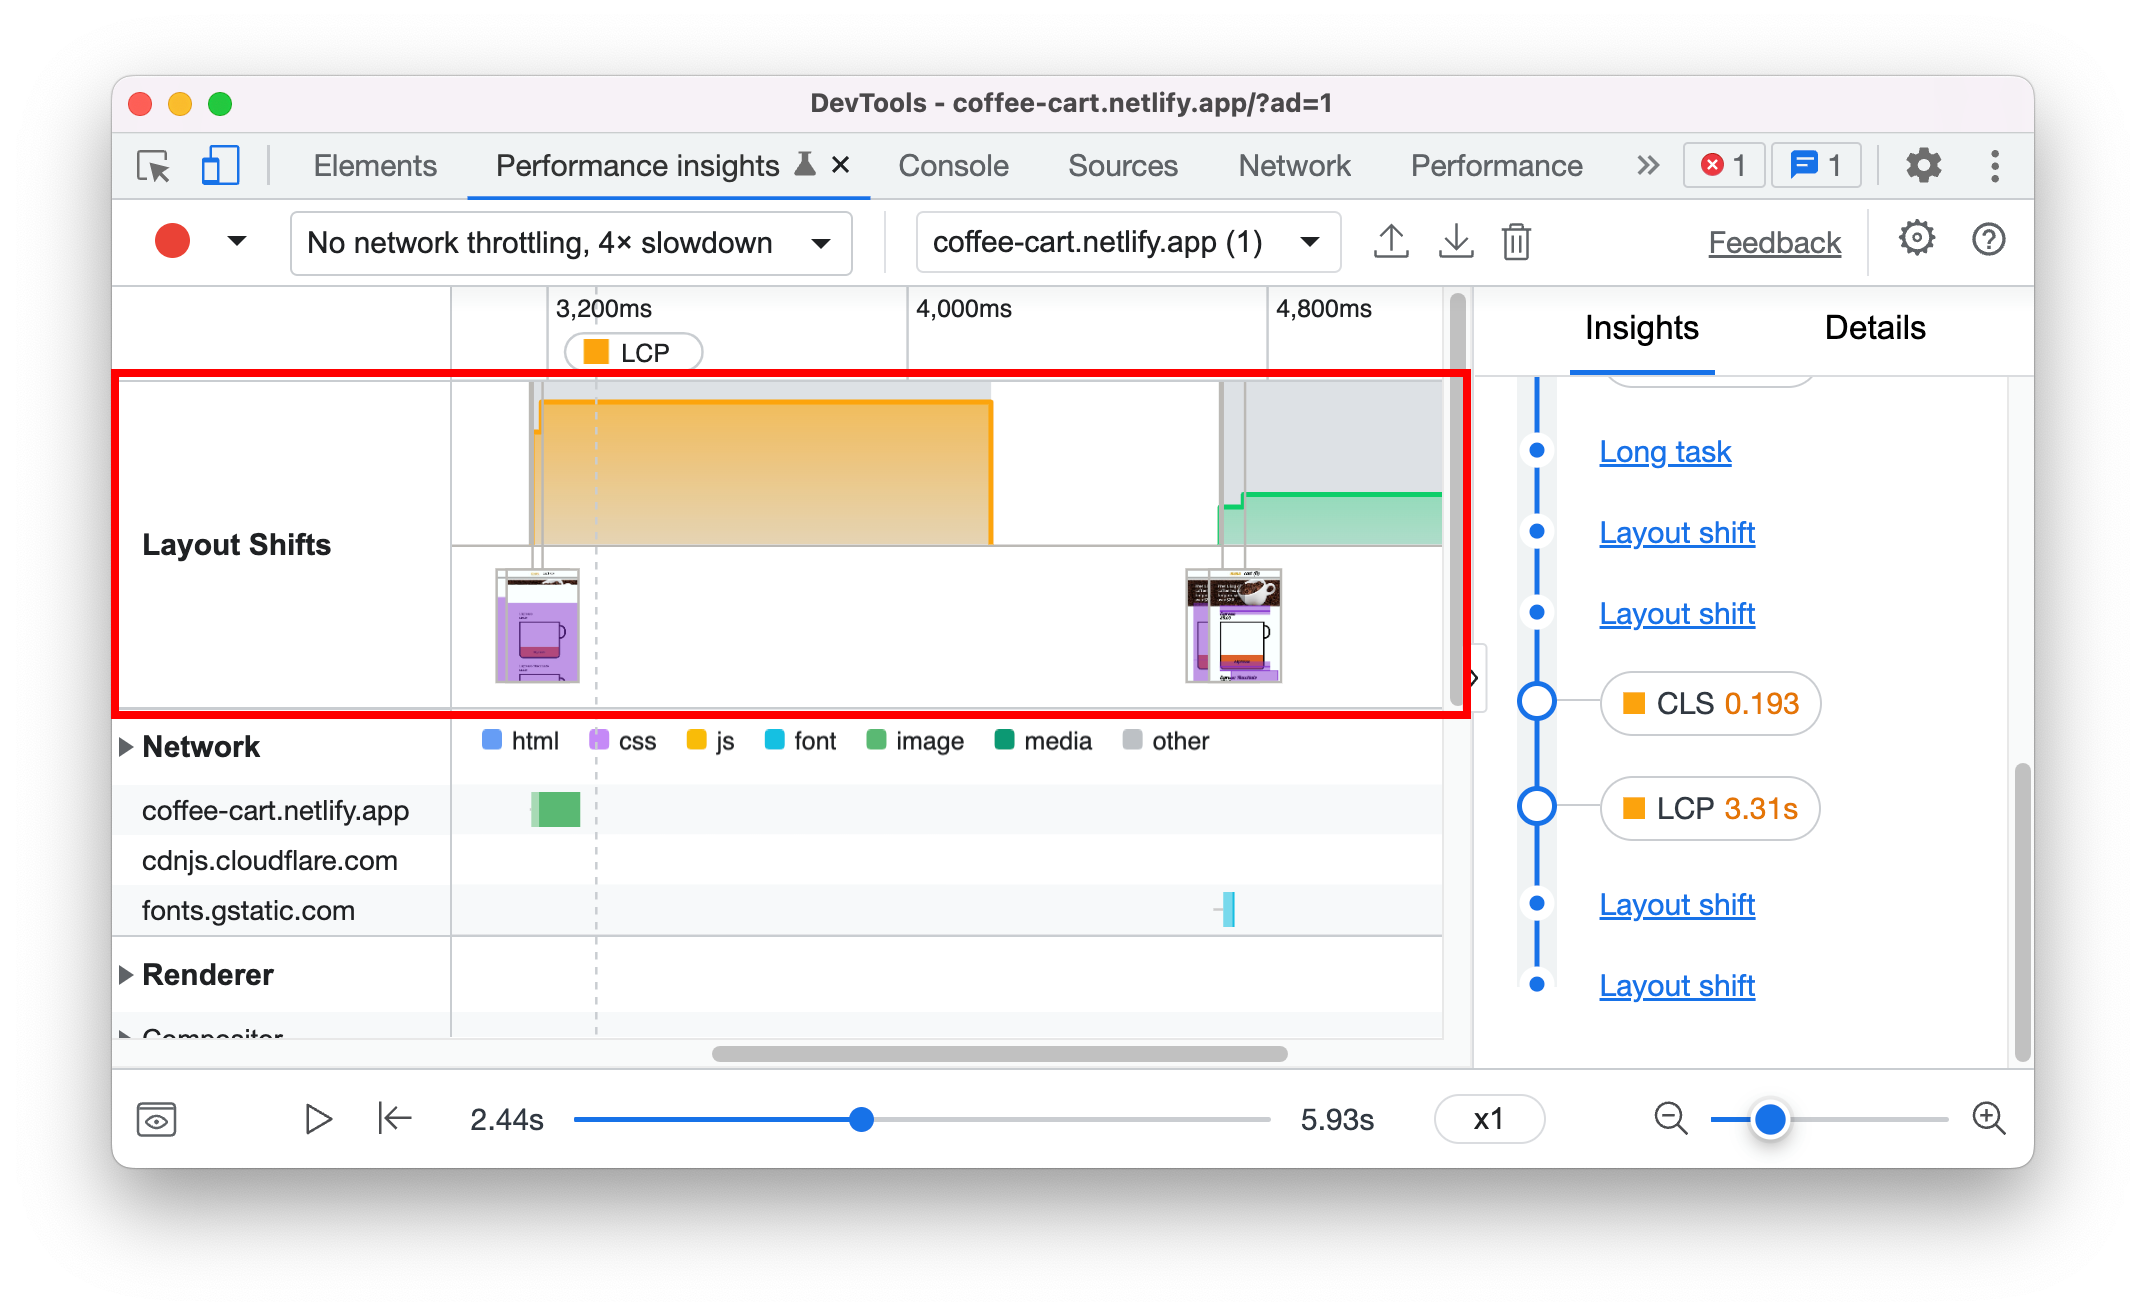
Layout shifts are grouped in session window. In the example above, there are 2 session windows. There are gaps between session windows.
Think about layout shifts like fireworks, there are times where multiple shifts happen at once, then it pauses for a while, and multiple shifts happen. Each set of multiple shifts is a session window. For more information, see Session window.

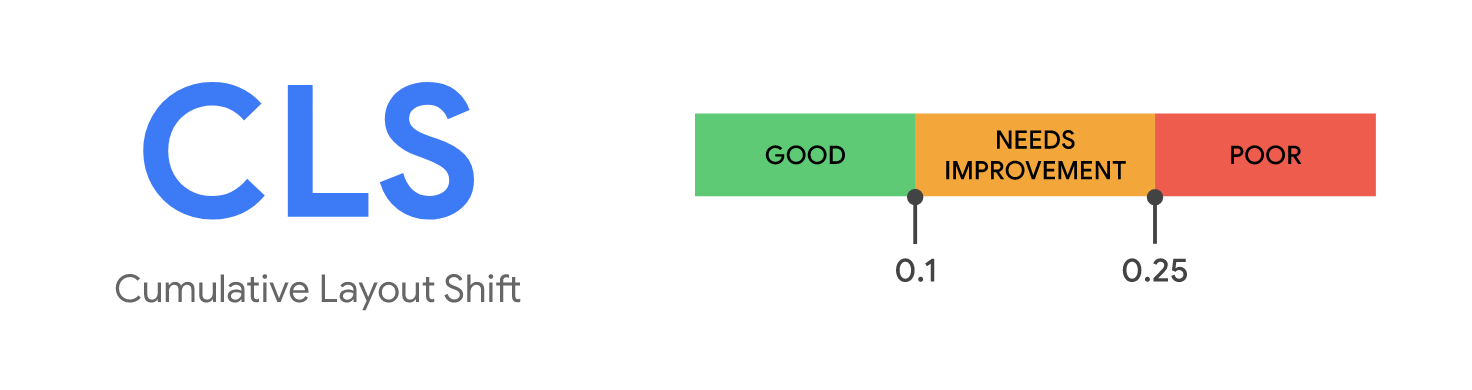
Cumulative Layout Shifts (CLS) is one of the core web vitals metrics. Use the Layout Shifts track to identify potential layout shifts issues and causes.
Always start with the largest session window when improving CLS metric. In our example, session window 1 is the largest session window, based on the background color and level.
Click on a screenshot to view the layout shift’s details, identify potential root causes and impacted elements.

In our example, the potential root cause is unsized media. See Optimize Cumulative Layout Shift to learn more about how to fix it.

Understand layout shifts score
In the Details pane, use the Window section to understand how the scores are calculated. The Window shows which session window the current layout shift belongs to.
The maximum score of each layout shift is 1, if the whole page is shifted. In our example, the first layout shift scored 0.15. The second layout shift scored 0.041.

The total score for this session window is 0.19. Based on the CLS threshold, it needs improvement. The session window background color reflects the same.
The session window background graph is increased over time. It is reflect the cumulative score of the layout shift at that point of time.

View network activity
View network activity in the Network track. You can expand the network track to view all the network activities and click on each item to view the details.
View renderer activity
View render activity in the Renderer track. You can expand each renderer to view the activities and click on each item to view the details.

View GPU activity
View GPU activity in the GPU track. The GPU track is hidden by default, enabling that in the settings.

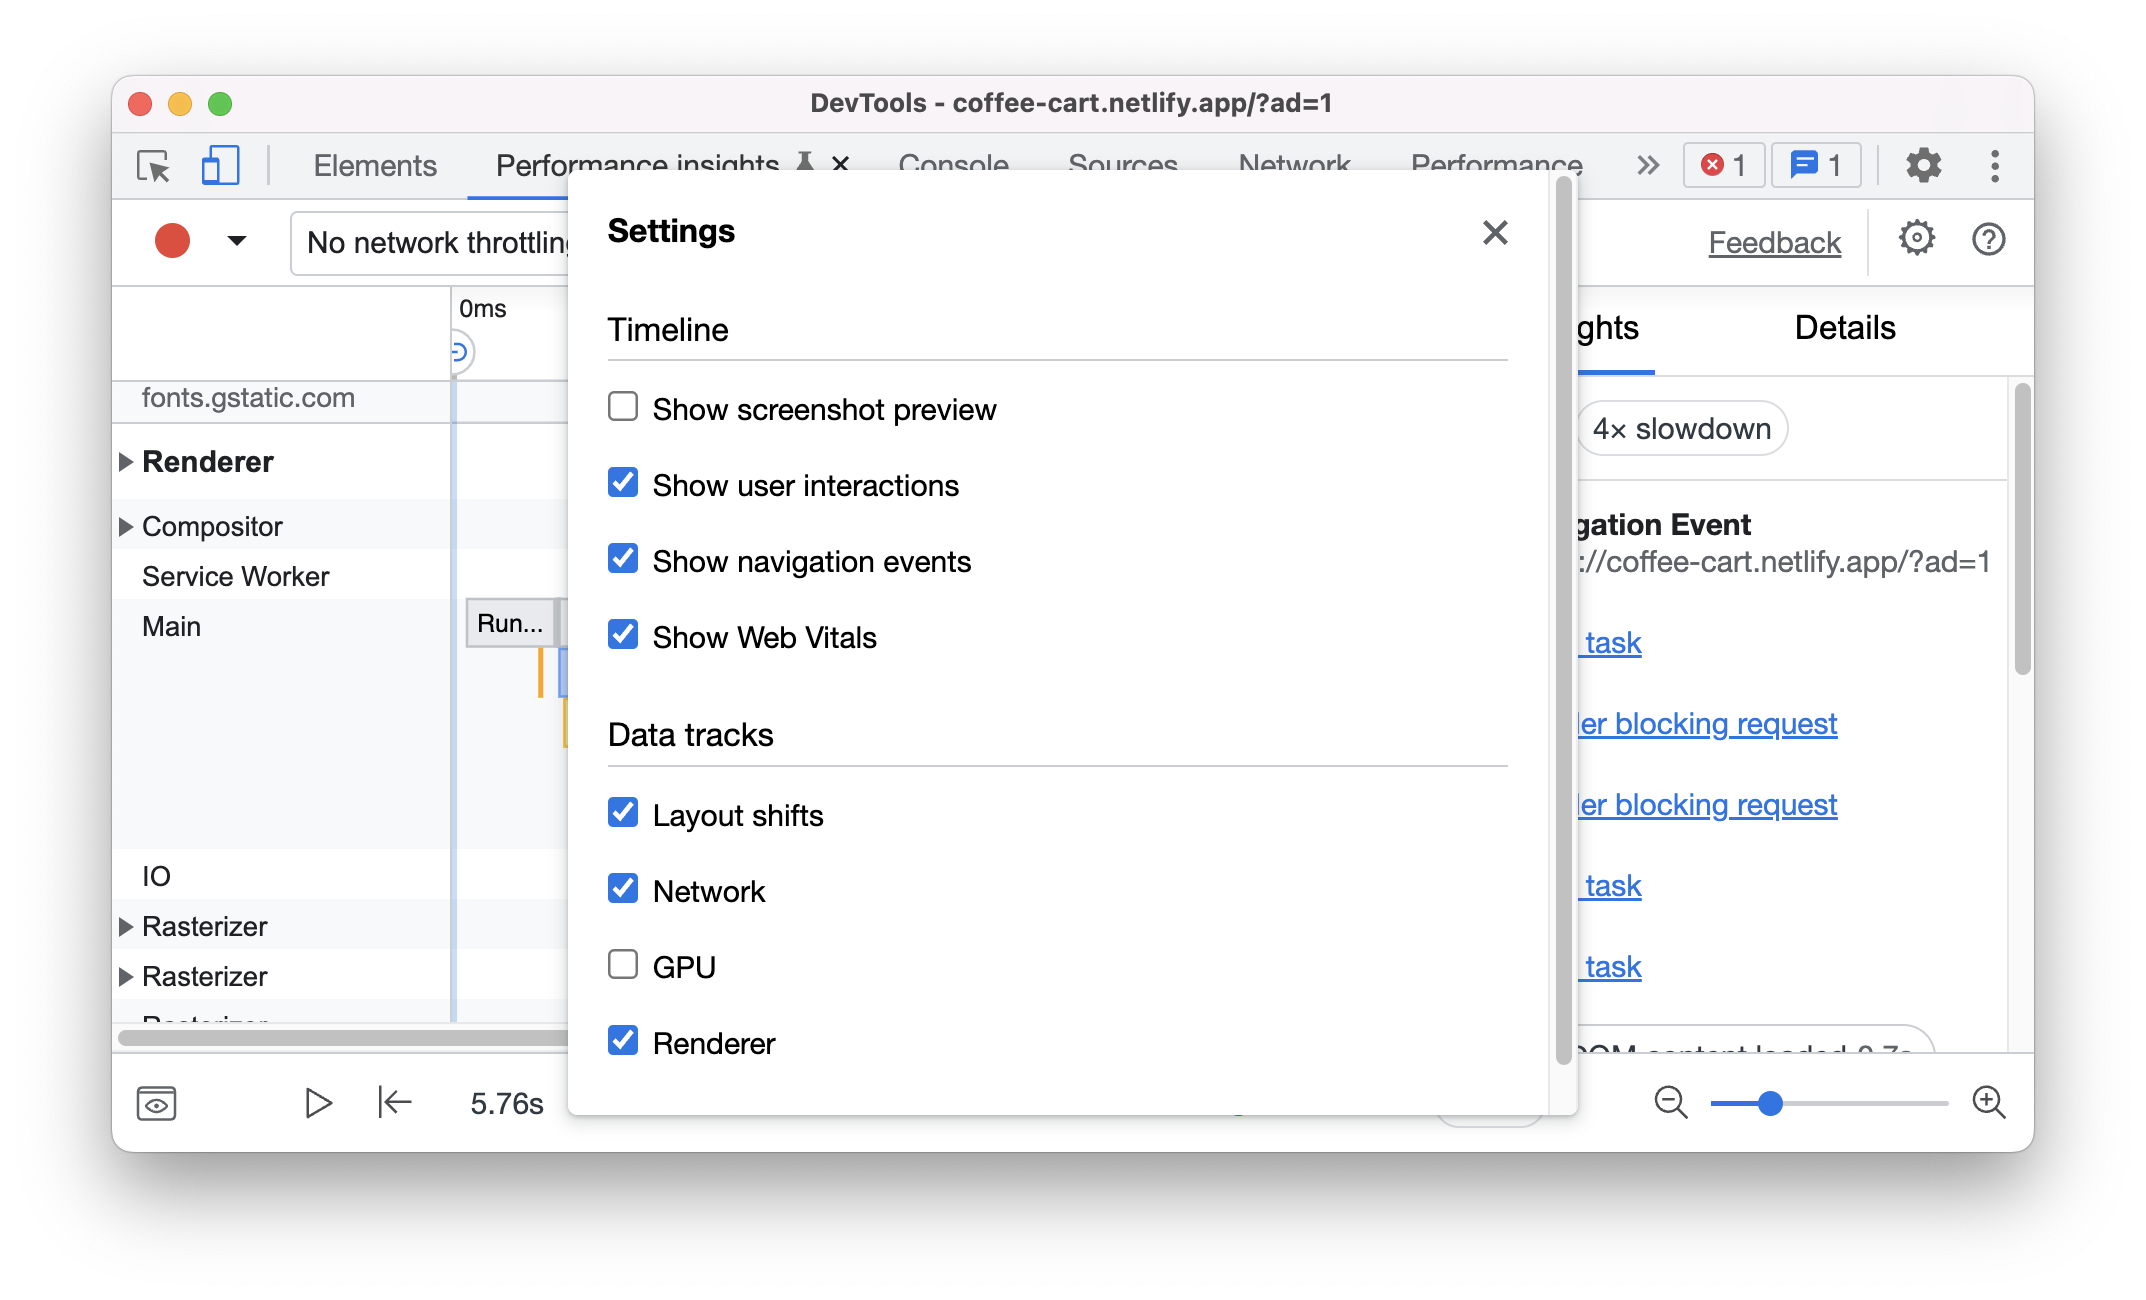
Customize the UI
Click Settings to customize the Timeline and Tracks.
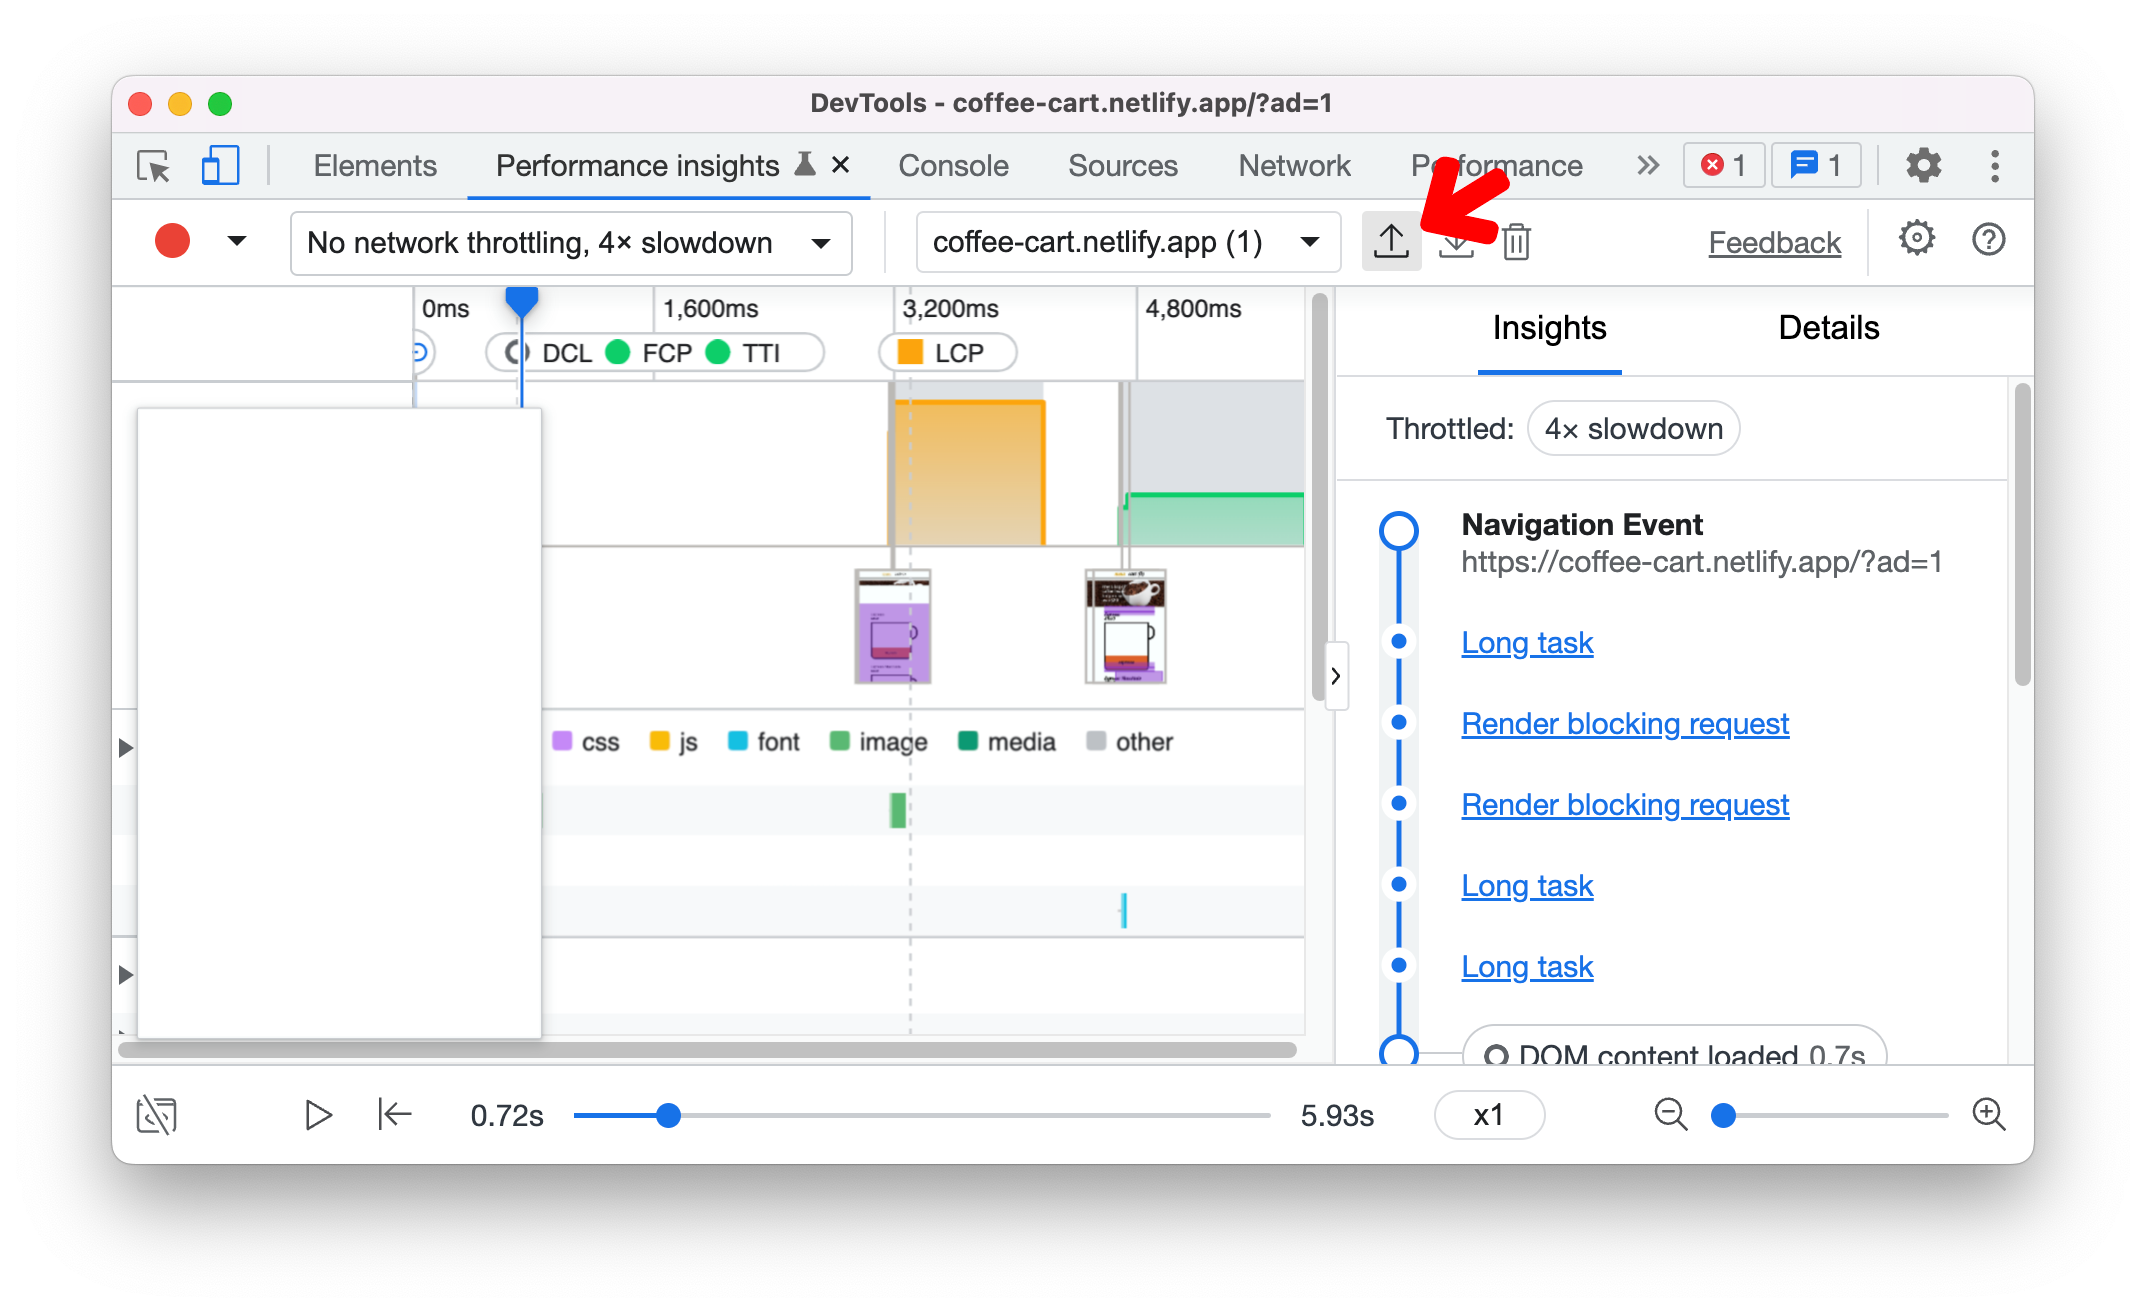
Export a recording
To save a recording, click Export.

Import a recording
To load a recording, select Import.
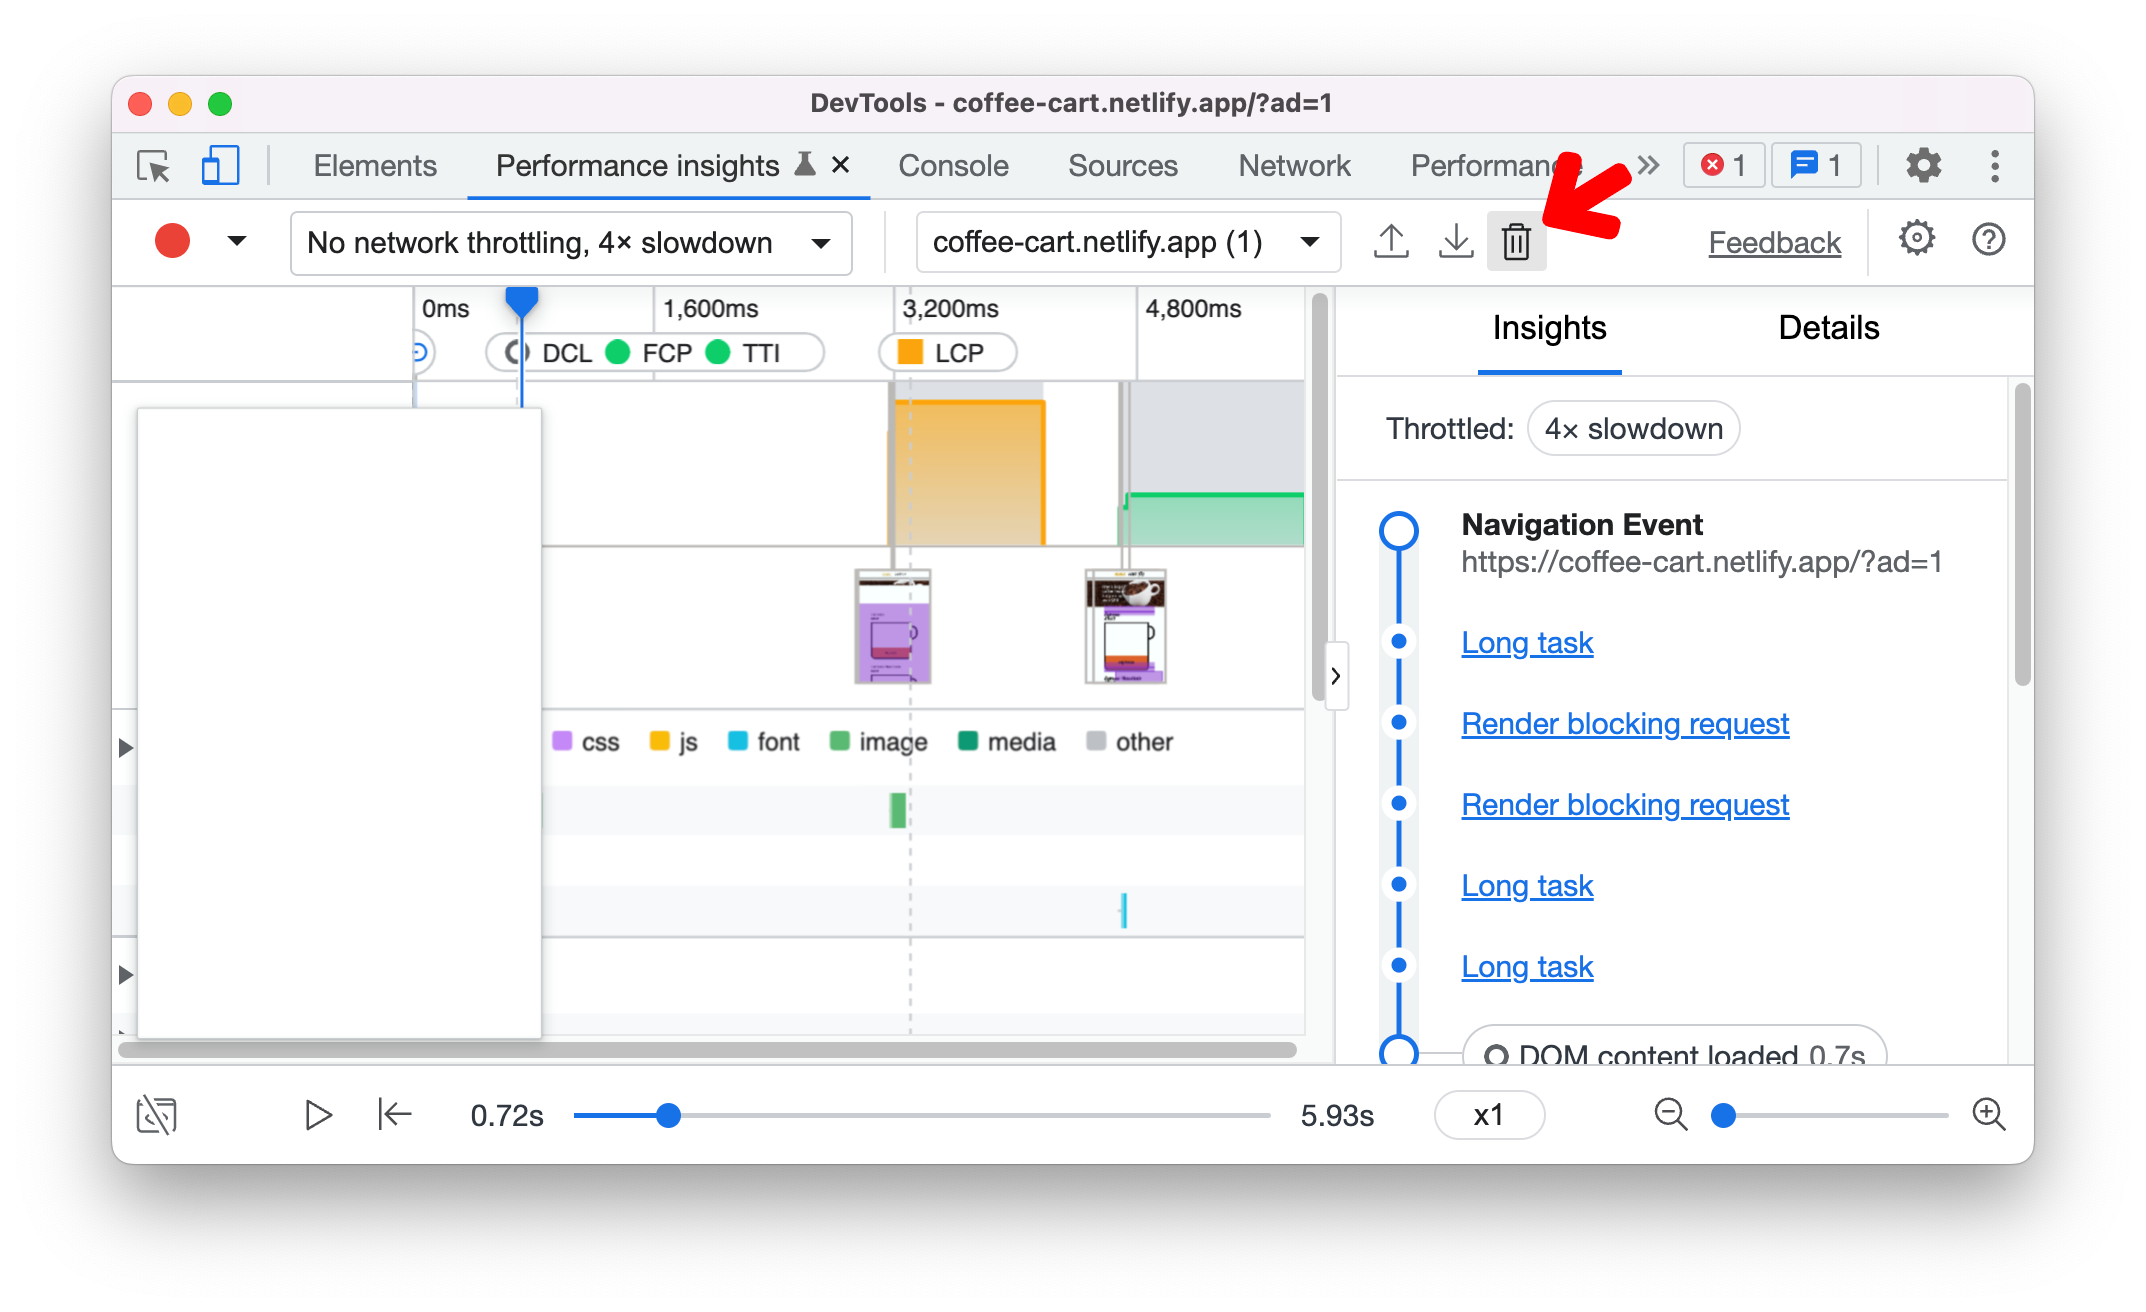
Delete a recording
After making a recording, press Delete to clear that recording from the panel.
Last updated: • Improve article