
Observe Ballerina Programs
Observability is a measure of how well the internal states of a system can be inferred from the knowledge of its external outputs.
Table of contents Expand all Collapse all
It consists of the three major pillars below.
- Metrics: numeric values that are collected and aggregated over a period of time.
- Tracing: the activities that occur when a request/transaction occurs in the system from the point of entry to exit.
- Logging: text records of activities that occurred with relevant information along with the timestamp.
Provide observability in Ballerina
Metrics, distributed tracing, and logging are key methods that reveal the internal state of the system to provide observability. Ballerina becomes fully observable by exposing itself via these three methods to various external systems allowing metrics such as request count and response time statistics to be monitored, perform distributed tracing, and analyze logs.
Ballerina services and any client connectors are observable by default. HTTP/HTTPS and SQL client connectors use semantic tags to make tracing and metrics monitoring more informative.
This guide focuses on enabling Ballerina service observability with some of its supported systems. Prometheus and Grafana are used for metrics monitoring, and Jaeger is used for distributed tracing. Ballerina logs can be fed to any external log monitoring system like the Elastic Stack to perform log monitoring and analysis.
Observe a Ballerina service
Follow the steps below to observe a sample Ballerina service.
Step 1 - set up the prerequisites
Install Docker to set up external systems such as Jaeger, Prometheus, etc. For instructions, go to the Docker documentation to install Docker.
Step 2 - install and configuring the external systems
- Set up Prometheus for collecting metrics information by following the section on Set up Prometheus
- Set up Grafana to visualize metrics by following the section on Set up Grafana
- Set up Jaeger to analyze tracing as mentioned in the section Set up Jaeger
- Set up Elastic Stack only if you are interested in analyzing logs by following the section on Set up the Elastic Stack
Step 3 - create a Hello World Ballerina service
Create a service as shown below and save it as hello_world_service.bal.
import ballerina/http;
import ballerina/log;
import ballerinax/prometheus as _;
import ballerinax/jaeger as _;

service /hello on new http:Listener(9090) {

    resource function get sayHello(http:Caller caller, http:Request req) returns error? {
        log:printInfo("This is a test Info log");
        log:printError("This is a test Error log");
        http:Response res = new;
        res.setPayload("Hello, World!");
        check caller->respond(res);
    }

}
Step 4 - observe the Hello World Ballerina service
By default, observability is not included in the executable created by Ballerina. It can be added
by using the --observability-included build flag or by adding the following section to the Ballerina.toml file.
[build-options]
observabilityIncluded=true
Note: the above configuration is included by default in the
Ballerina.tomlfile generated when initiating a new project using thebal newcommand.
To include the Prometheus and Jaeger extensions into the executable, the
ballerinax/prometheus and ballerinax/jaeger modules need to be imported into your Ballerina code.
import ballerinax/prometheus as _;
import ballerinax/jaeger as _;
Observability is disabled by default at runtime as well and it can be enabled selectively for metrics and tracing by adding
the following runtime configurations to the Config.toml file.
[ballerina.observe]
metricsEnabled=true
metricsReporter="prometheus"
tracingEnabled=true
tracingProvider="jaeger"
The created configuration file can be passed to the Ballerina program with the BAL_CONFIG_FILES environment variable along with
the path of the configuration file. This is not necessary if the Config.toml file is present in the current working directory.
$ BAL_CONFIG_FILES=<path-to-conf>/Config.toml bal run --observability-included hello_world_service.bal

ballerina: started Prometheus HTTP listener 0.0.0.0:9797
ballerina: started publishing traces to Jaeger on localhost:55680
When Ballerina observability is enabled, the Ballerina runtime exposes internal metrics via an HTTP endpoint (/metrics) for metrics monitoring and traces will be published to Jaeger. Prometheus should be configured to scrape metrics from the metrics HTTP endpoint in Ballerina.
Ballerina logs are logged on the console. Therefore, the logs need to be redirected to a file, which can then be pushed to Elastic Stack to perform the log analysis.
Therefore, redirect the standard output to a file if you want to monitor logs.
$ BAL_CONFIG_FILES=<path-to-conf>/Config.toml nohup bal run --observability-included hello_world_service.bal > ballerina.log &
Step 5 - send requests
Send requests to http://localhost:9090/hello/sayHello.
Example cURL command:
$ curl http://localhost:9090/hello/sayHello
Step 6 - view metrics and tracing dashboards
View the tracing information on Jaeger via http://localhost:16686/ and view metrics information from the Grafana dashboard on http://localhost:3000/.
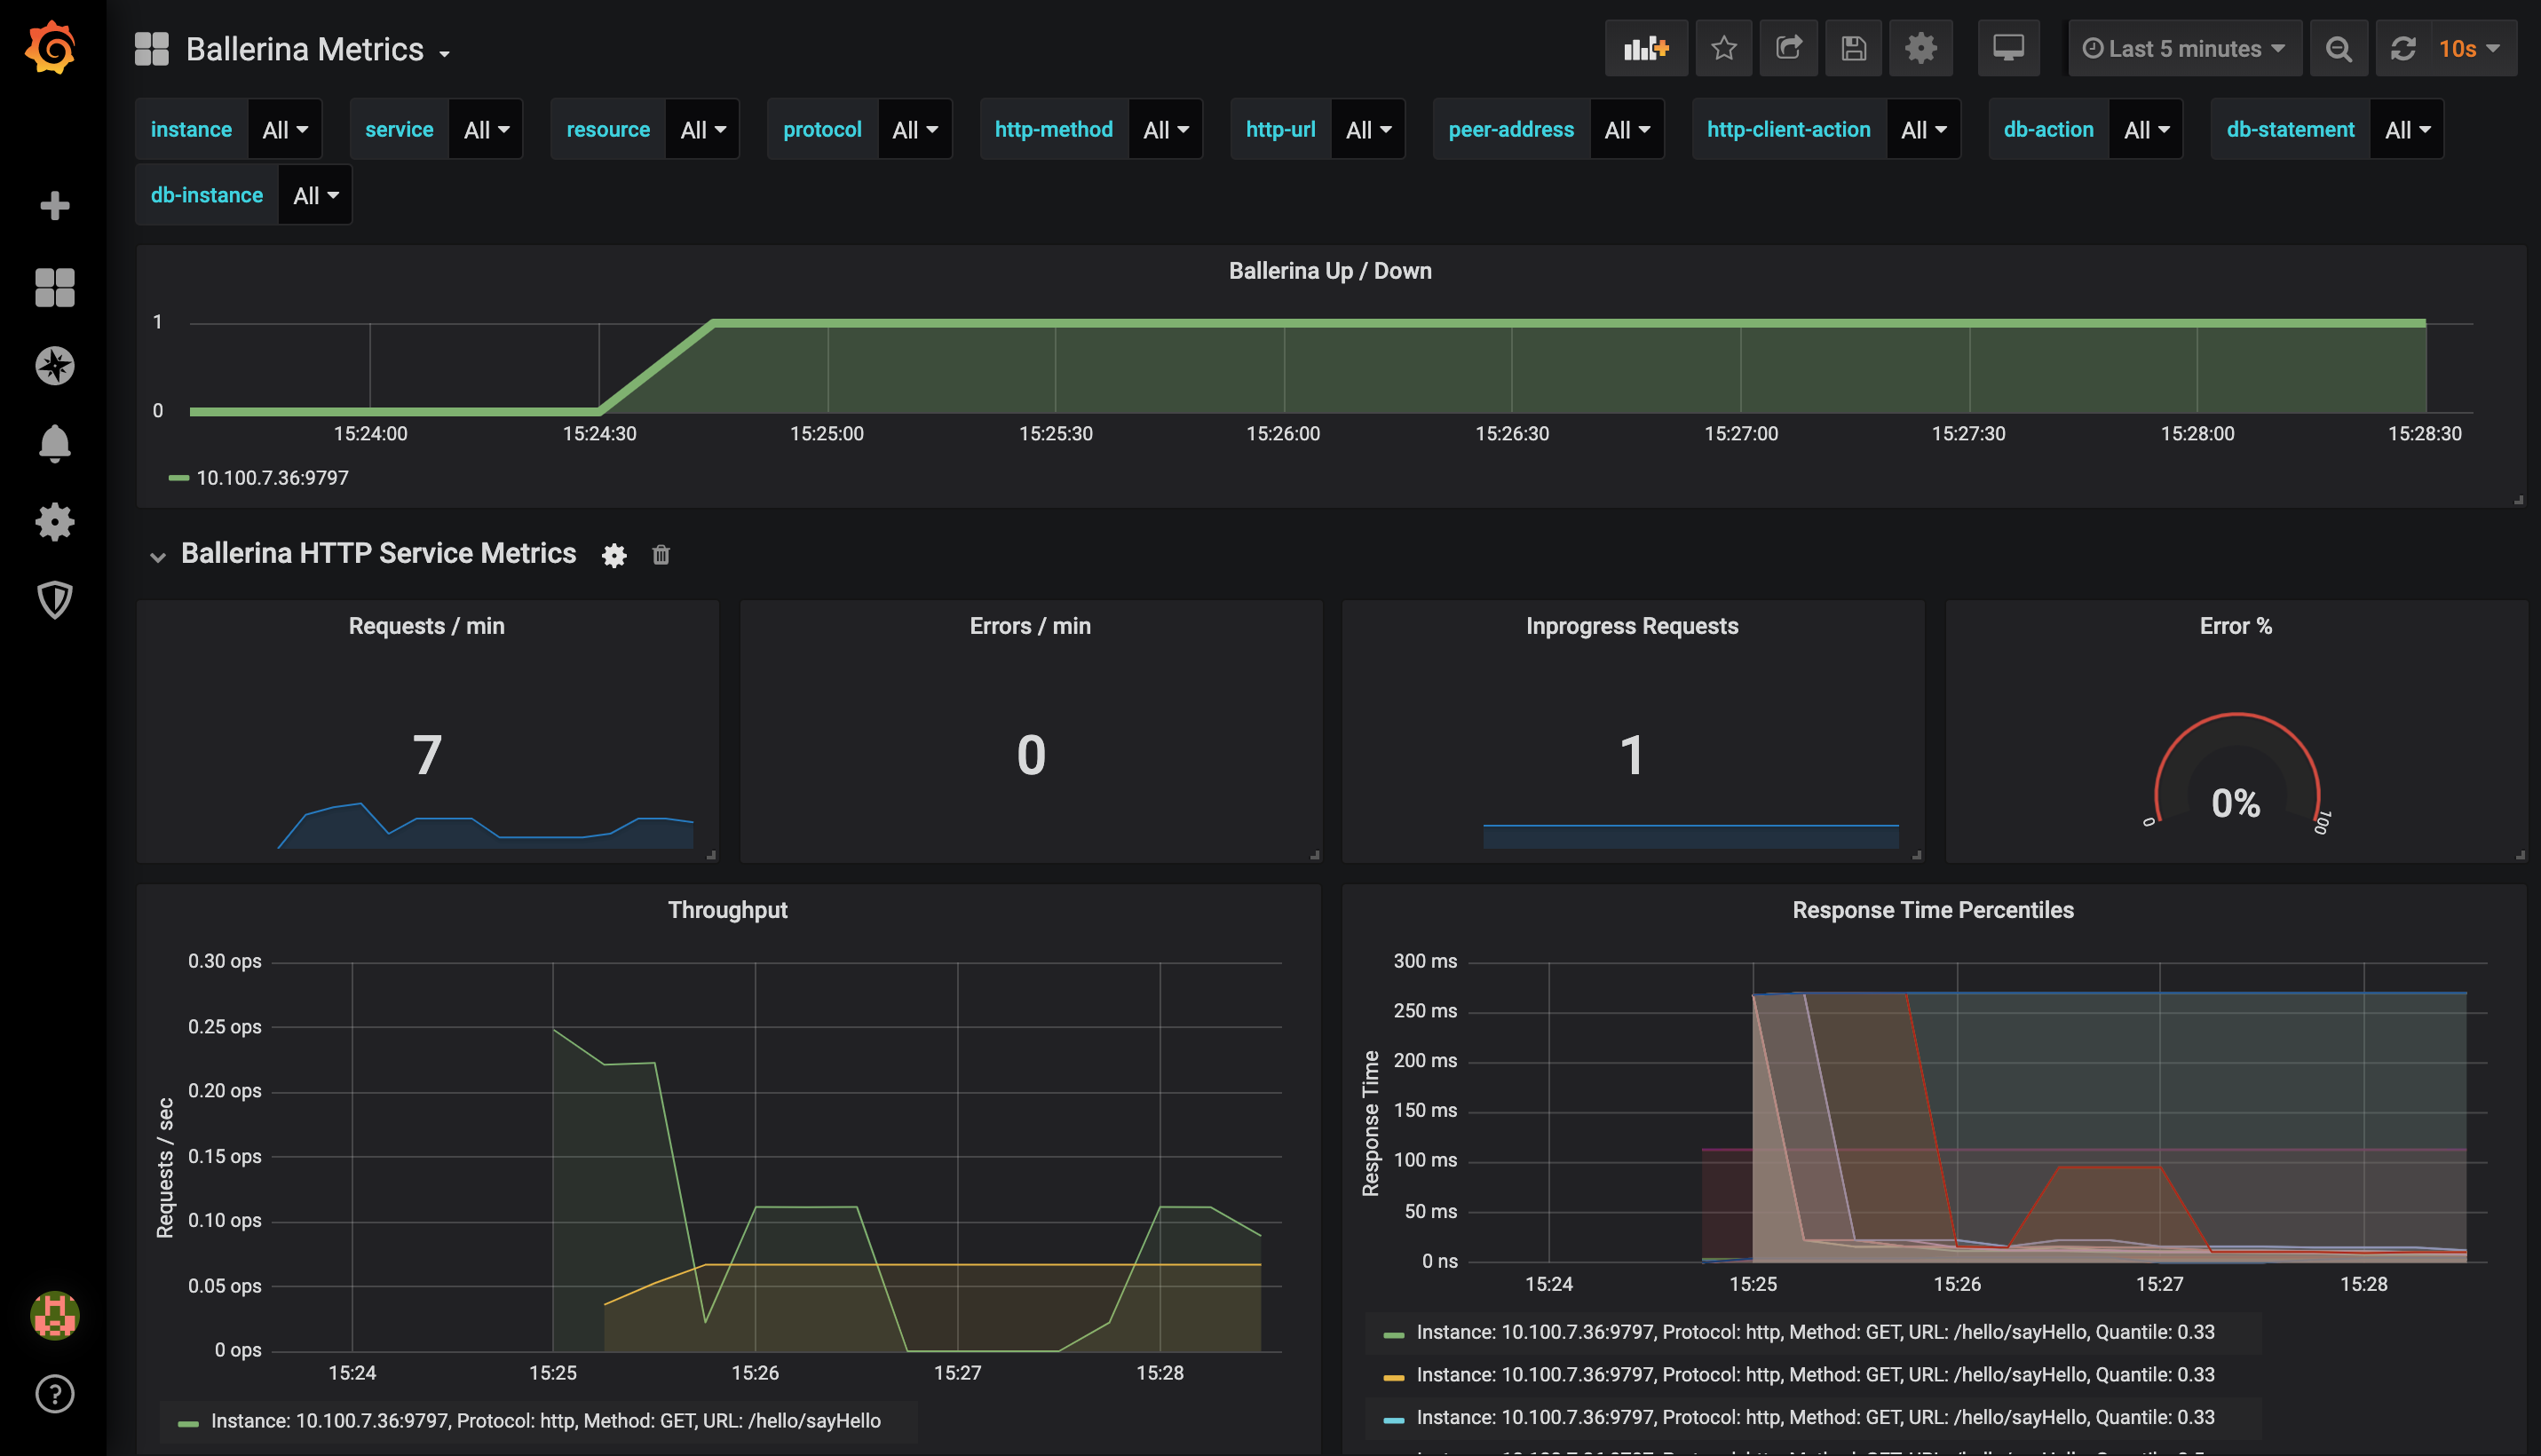
A sample view of the Grafana dashboard for the hello_world_service.bal is shown below.
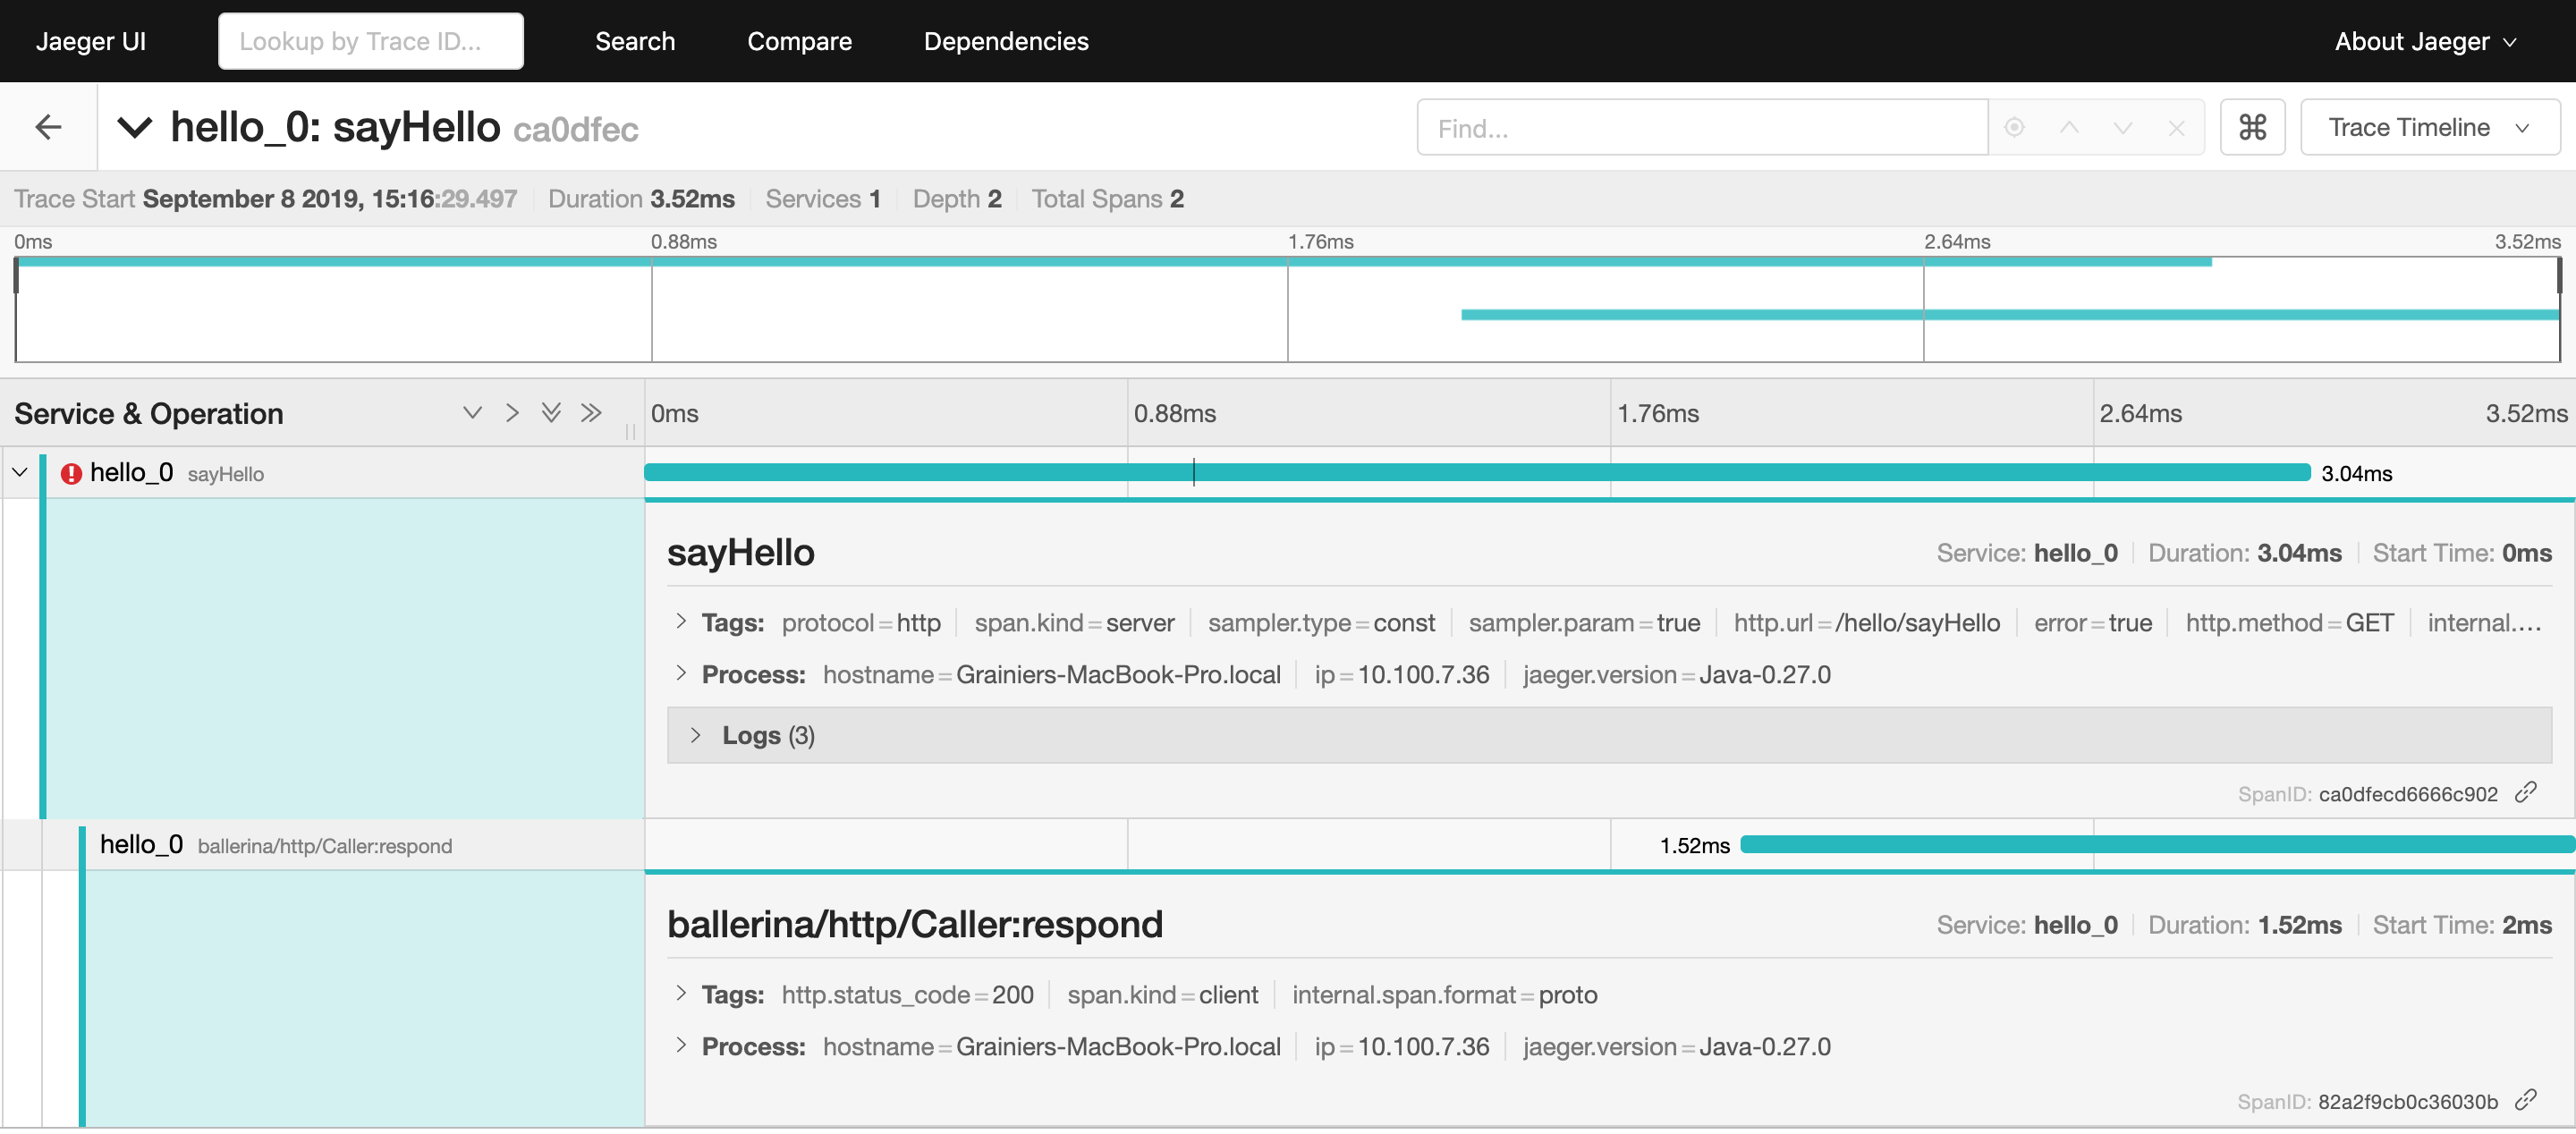
A sample view of the Jaeger dashboard for the hello_world_service.bal is shown below.
Step 7 - visualize the logs
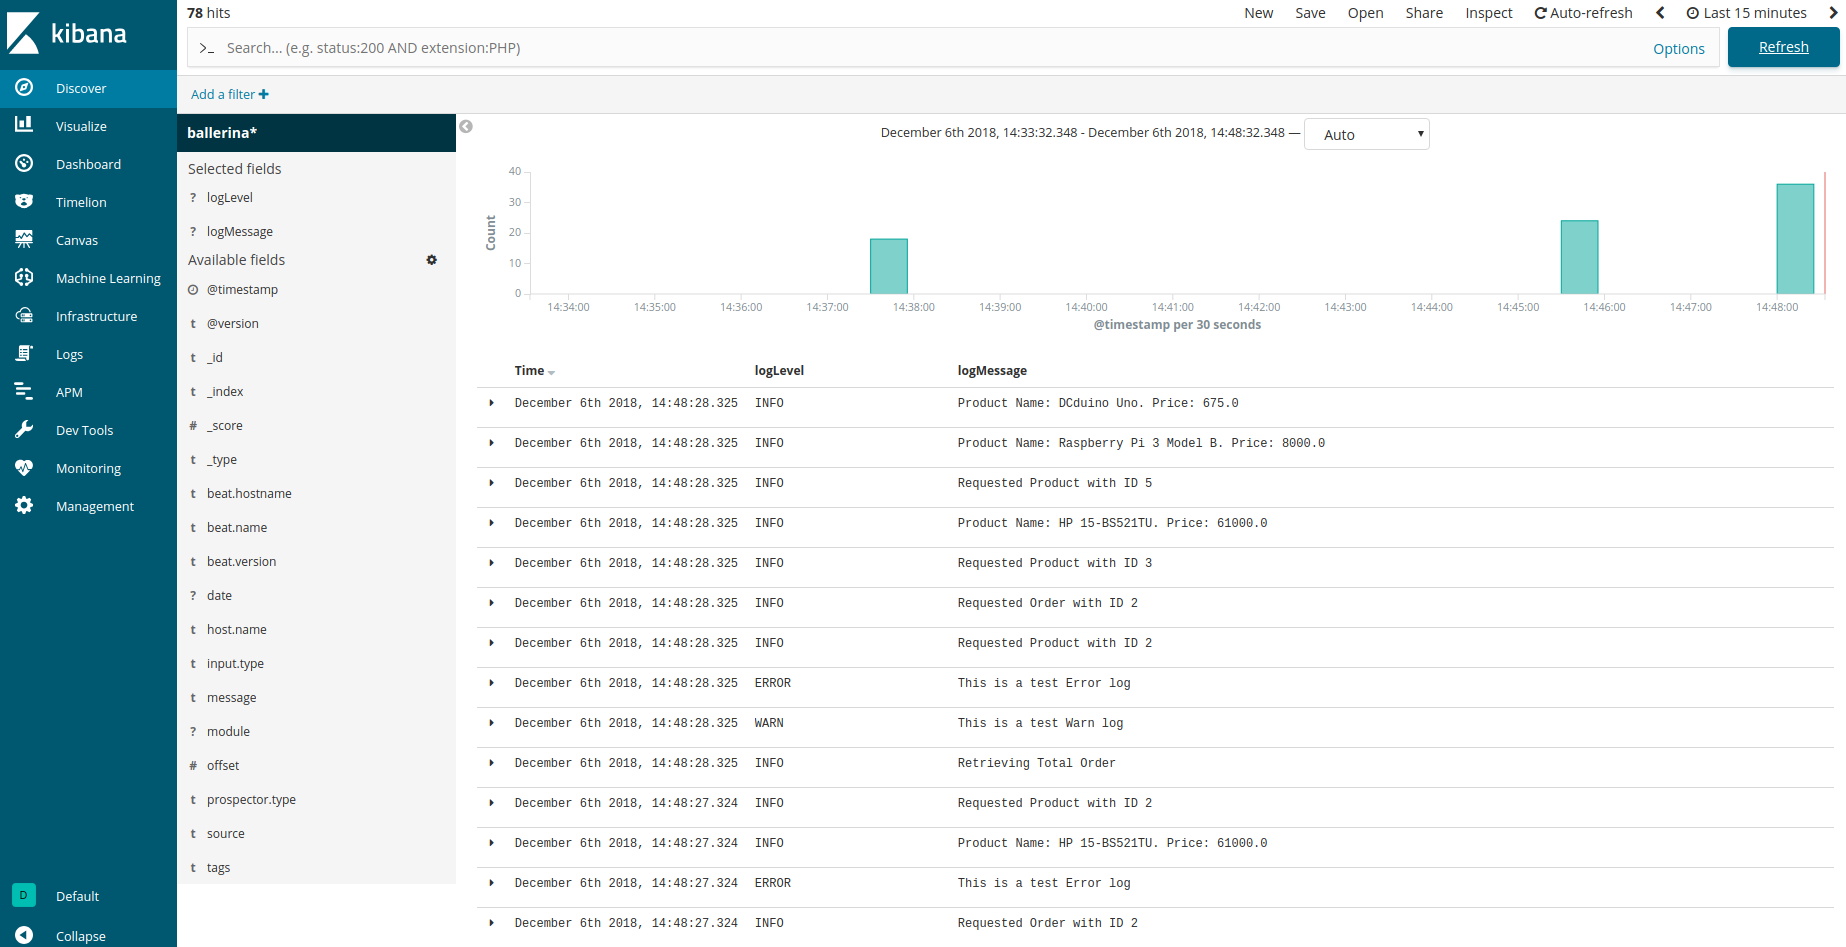
If you have configured log analytics, the logs can be viewed in Kibana via http://localhost:5601.
Monitor metrics
Metrics help to monitor the runtime behavior of a service. Therefore, metrics are a vital part of monitoring Ballerina services. However, metrics are not the same as analytics. For example, it should not be used to perform per-request billing or similar use cases. Metrics are used to measure what a Ballerina service does at runtime to make better decisions using the numbers. The code generates business value when it continuously runs in production. Therefore, it is imperative to continuously measure the code in production.
To support Prometheus as the metrics reporter, an HTTP endpoint starts with the context
of /metrics in default port 9797 when starting the Ballerina service.
Configure advanced metrics
This section focuses on the Ballerina configurations that are available for metrics monitoring with Prometheus, and the sample configuration is provided below.
[ballerina.observe]
metricsEnabled=true
metricsReporter="prometheus"

[ballerinax.prometheus]
port=9797
host="0.0.0.0"
The descriptions of each configuration option are provided below with possible values.
| Configuration key | Description | Default value | Possible values |
|---|---|---|---|
| ballerina.observe. metricsEnabled | Whether metrics monitoring is enabled (true) or disabled (false) | false | true or false |
| ballerina.observe. metricsReporter | Reporter name that reports the collected Metrics to the remote metrics server. This is only required to be modified if a custom reporter is implemented and needs to be used. | choreo | prometheus or if any custom implementation, the name of the reporter. |
| ballerinax.prometheus. port | The value of the port to which the ‘/metrics’ service will bind to. This service will be used by Prometheus to scrape the information of the Ballerina service. | 9797 | Any suitable value for port 0 - 0 - 65535. However, within that range, ports 0 - 1023 are generally reserved for specific purposes, therefore it is advisable to select a port without that range. |
| ballerinax.prometheus. host | The name of the host to which the ‘/metrics’ service will bind to. This service will be used by Prometheus to scrape the information of the Ballerina service. | 0.0.0.0 | IP or Hostname or 0.0.0.0 of the node in which the Ballerina service is running. |
Set up the external systems for metrics
There are mainly two systems involved in collecting and visualizing the metrics. Prometheus is used to collect the metrics from the Ballerina service while Grafana can be used to connect to Prometheus and visualize the metrics on the dashboard.
Set up Prometheus
Prometheus is used as the monitoring system, which pulls out the metrics collected from the Ballerina /metrics service. This section focuses on the quick installation of Prometheus with Docker and the configuration required to
collect metrics from the Ballerina service with the default configurations. Follow the steps below to configure
Prometheus.
Tip: There are many other ways to install Prometheus and you can find possible options from the installation guide.
-
Create a
prometheus.ymlfile in the/tmp/directory. -
Add the following content to the
/tmp/prometheus.ymlfile.global: scrape_interval: 15s evaluation_interval: 15s scrape_configs: - job_name: 'prometheus' static_configs: - targets: ['a.b.c.d:9797']Here, the
'a.b.c.d:9797'targets should contain the host and port of the/metricsservice that is exposed from Ballerina for metrics collection. Add the IP of the host in which the Ballerina service is running asa.b.c.dand its port (default9797). If you need more information, go to the Prometheus documentation.If your Ballerina service is running on localhost and Prometheus in a Docker container, add the target as
host.docker.internal:9797to access the localhost from Docker. -
Start the Prometheus server in a Docker container with the command below.
$ docker run -p 19090:9090 -v /tmp/prometheus.yml:/etc/prometheus/prometheus.yml prom/prometheus -
Go to http://localhost:19090/ and check whether you can see the Prometheus graph. Ballerina metrics should appear in Prometheus graph’s metrics list when the Ballerina service is started.
Set up Grafana
Let’s use Grafana to visualize metrics in a dashboard. For this, we need to install Grafana and configure Prometheus as a data source. Follow the steps below to configure Grafana.
-
Start Grafana as a Docker container with the command below.
$ docker run -d --name=grafana -p 3000:3000 grafana/grafanaFor more information, go to Grafana in Docker Hub.
-
Go to http://localhost:3000/ to access the Grafana dashboard running on Docker.
-
Login to the dashboard with the default user, username:
adminand password:admin -
Add Prometheus as a data source with
Browseraccess configuration as provided below.
-
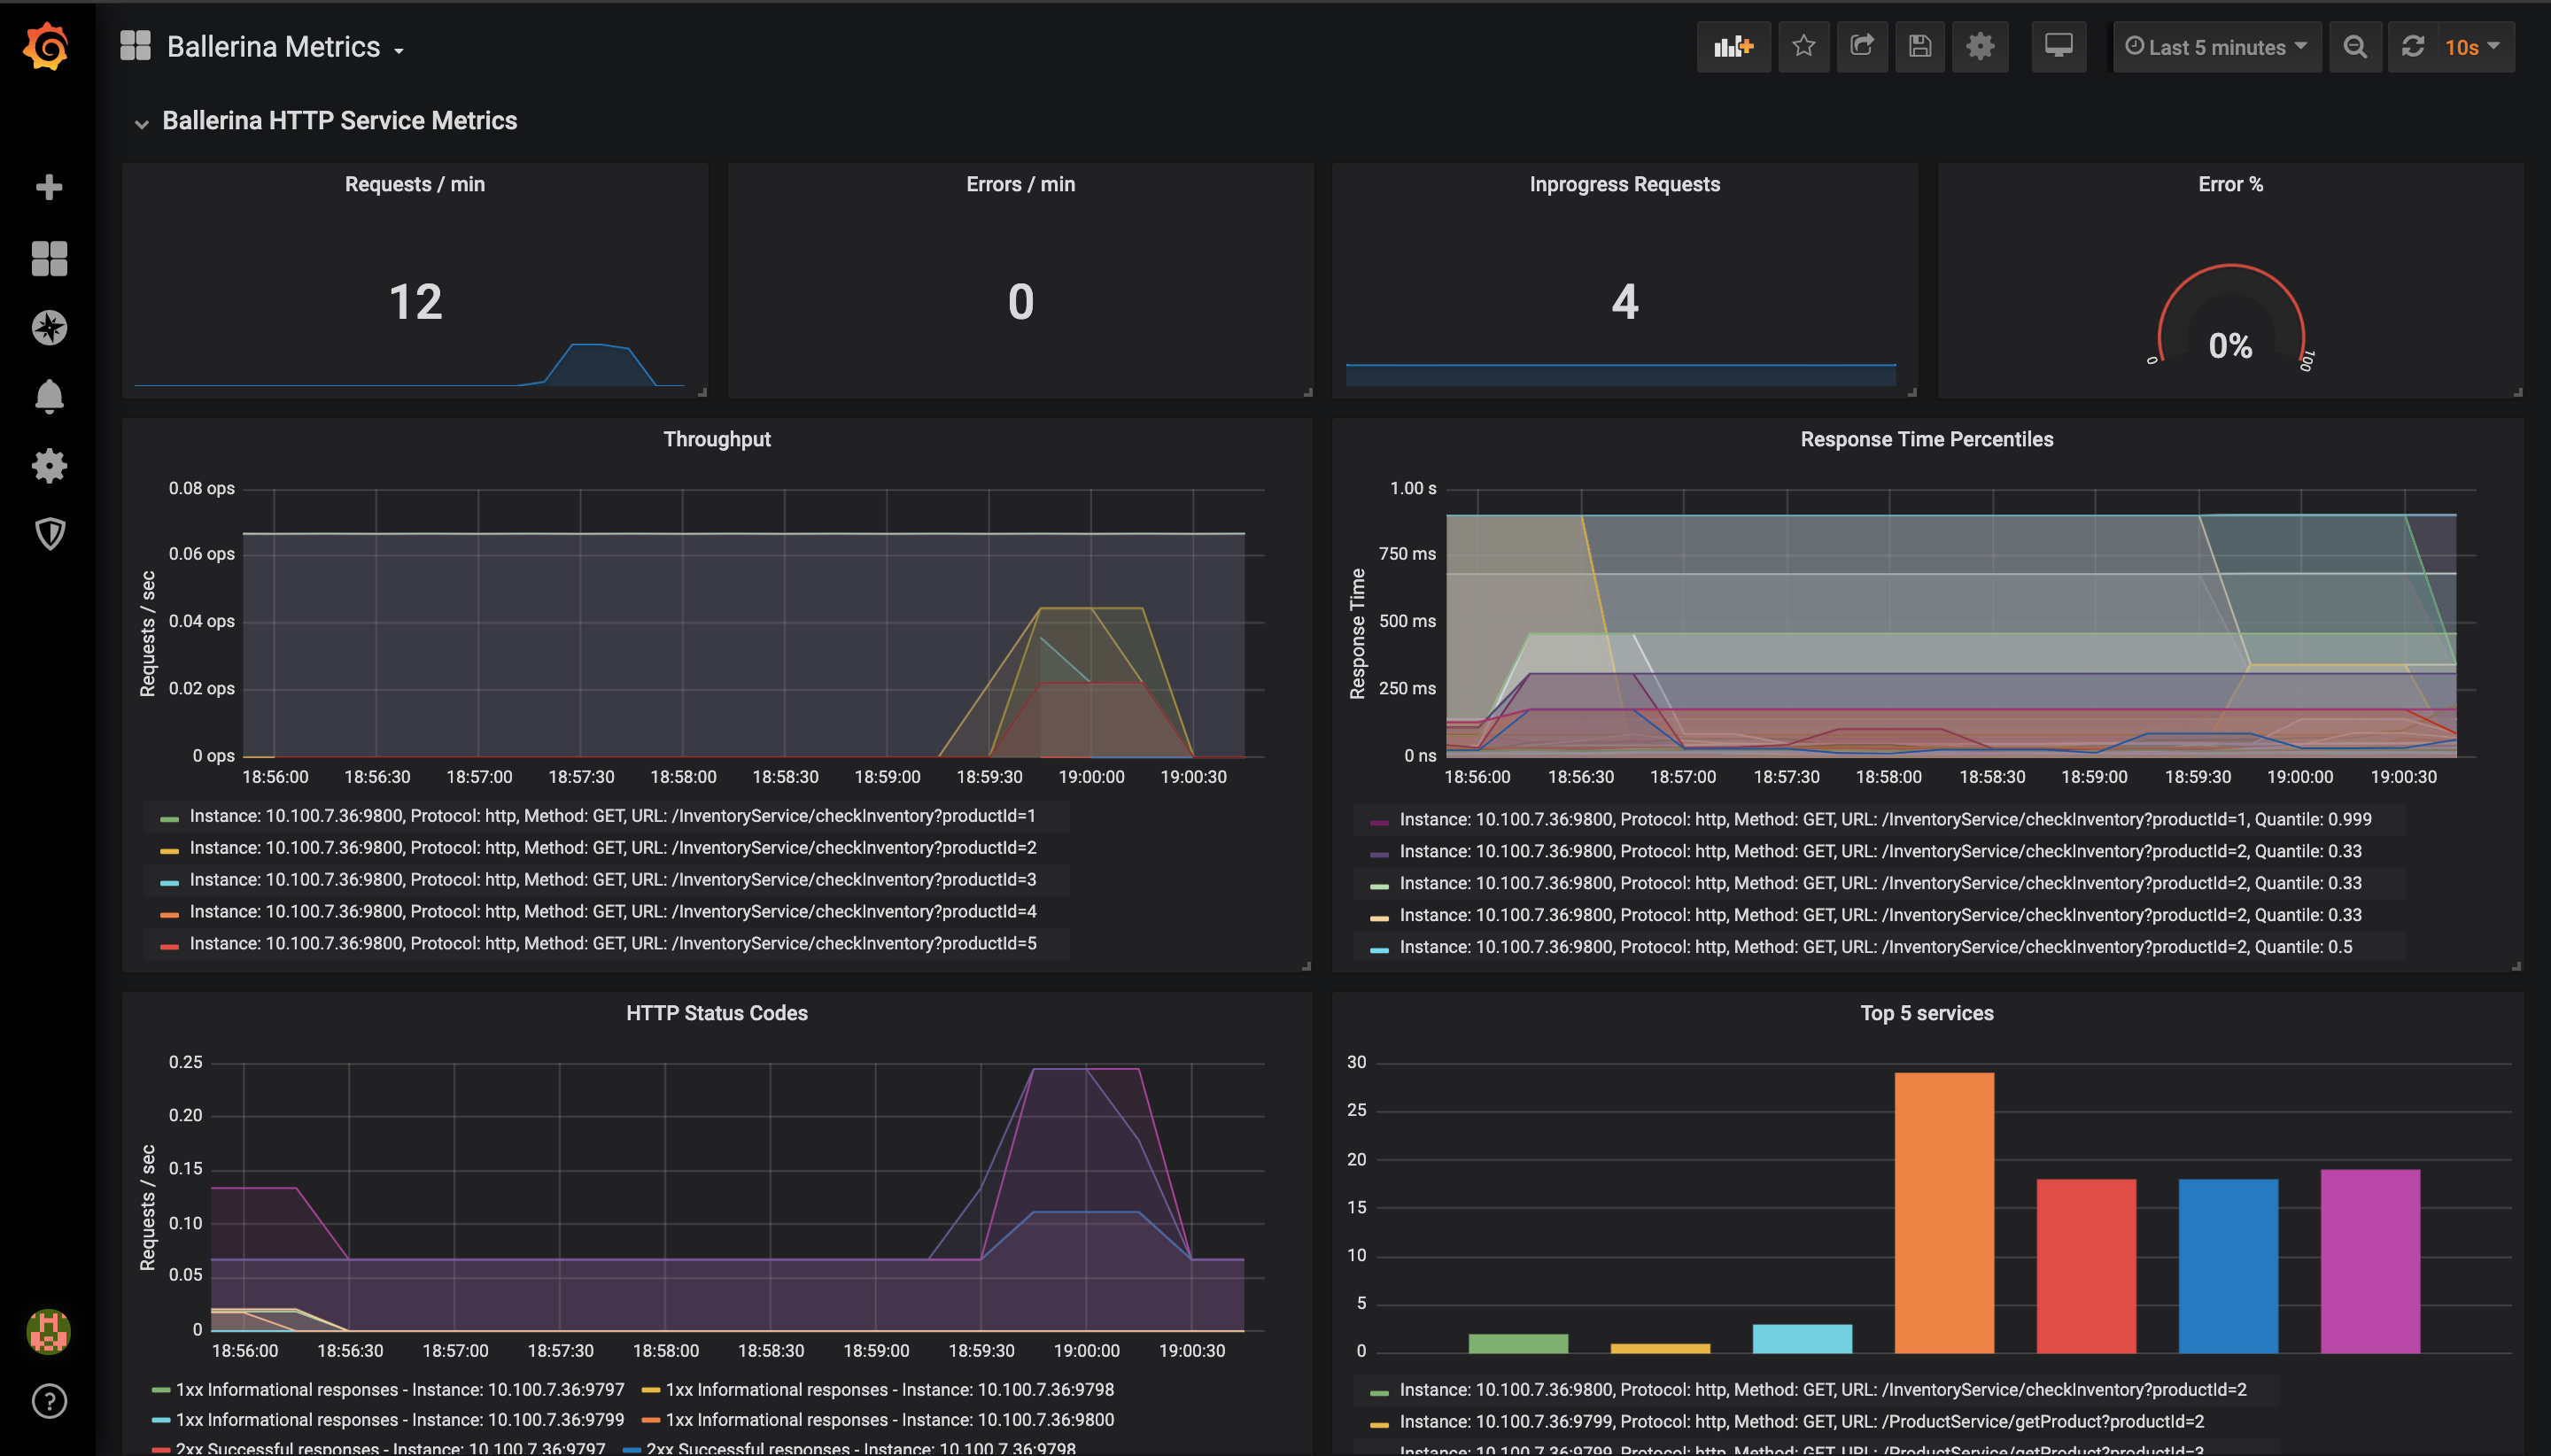
Import the Grafana dashboard designed to visualize Ballerina metrics from https://grafana.com/dashboards/5841. This dashboard consists of service and client invocation level metrics in near real-time view.
The Ballerina HTTP Service Metrics Dashboard Panel will be as shown below.
Distributed tracing
Tracing provides information regarding the roundtrip of a service invocation based on the concept of spans, which are structured in a hierarchy based on the cause and effect concept. A trace can spread across several services that can be deployed in several nodes, depicting a high-level view of interconnections among services as well, hence coining the term distributed tracing.
A span is a logical unit of work, which encapsulates a start and end time as well as metadata to give more meaning to the unit of work being completed. For example, a span representing a client call to an HTTP endpoint would give the user the latency of the client call and metadata like the HTTP URL being called, and the HTTP method used. If the span represents an SQL client call, the metadata would include the query being executed.
Tracing gives the user a high-level view of how a single service invocation is processed across several distributed microservices.
- Identify service bottlenecks - The user can monitor the latencies and identify when a service invocation slows down, pinpoint where the slowing down happens (by looking at the span latencies), and take action to improve the latency.
- Error identification - If an error occurs during the service invocation, it will show up in the list of traces. The user can easily identify where the error occurred and information of the error will be attached to the relevant span as metadata.
Ballerina supports OpenTelemetry standards by default. This means that Ballerina services can be traced using OpenTelemetry implementations like Jaeger.
Configure advanced tracing
Tracing can be enabled in Ballerina with the few configurations mentioned above in the Observe a Ballerina service section. This section mainly focuses on the configuration options with the description and possible values.
A sample configuration that enables tracing and uses Jaeger as the tracer is provided below.
[ballerina.observe]
tracingEnabled=true
tracingProvider="jaeger"
The table below provides the descriptions of each configuration option and possible values that can be assigned.
| Configuration key | Description | Default value | Possible values |
|---|---|---|---|
| ballerina.observe.tracingEnabled | Whether tracing is enabled (true) or disabled (false) | false | true or false |
| ballerina.observe.tracingProvider | The tracer name, which implements the tracer interface. | choreo | jaeger or the name of the tracer of any custom implementation. |
Use the Jaeger extension
Below are the sample configuration options that are available to support Jaeger as the tracer provider in Ballerina.
[ballerina.observe]
tracingEnabled=true
tracingProvider="jaeger"

[ballerinax.jaeger]
agentHostname="localhost"
agentPort=55680
samplerType="const"
samplerParam=1.0
reporterFlushInterval=2000
reporterBufferSize=1000
The table below provides the descriptions of each configuration option and possible values that can be assigned.
| Configuration key | Description | Default value | Possible values |
|---|---|---|---|
| ballerina.observe. agentHostname | Hostname of the Jaeger agent | localhost | IP or hostname of the Jaeger agent. If it is running on the same node as Ballerina, it can be localhost. |
| ballerina.observe. agentPort | Port of the Jaeger agent | 55680 | The port on which the Jaeger agent is listening. |
| ballerina.observe. samplerType | Type of the sampling methods used in the Jaeger tracer. | const | const, probabilistic, or ratelimiting. |
| ballerina.observe. samplerParam | It is a floating value. Based on the sampler type, the effect of the sampler param varies | 1.0 | For const 0 (no sampling) or 1 (sample all spans), for probabilistic 0.0 to 1.0, for ratelimiting any positive integer (rate per second). |
| ballerina.observe. reporterFlushInterval | The Jaeger client will be sending the spans to the agent at this interval. | 2000 | Any positive integer value. |
| ballerina.observe. reporterBufferSize | Queue size of the Jaeger client. | 2000 | Any positive integer value. |
Set up the external systems for tracing
You can configure Ballerina to support distributed tracing with Jaeger. This section focuses on configuring Jaeger with Docker as a quick installation.
Set up the Jaeger server
There are many possible ways to deploy Jaeger. For more information, see Jaeger Deployment. This focuses on an all-in-one deployment with Docker.
-
Install Jaeger via Docker and start the Docker container by executing the command below.
$ docker run -d -p 13133:13133 -p 16686:16686 -p 55680:55680 jaegertracing/opentelemetry-all-in-one -
Go to http://localhost:16686 and load the web UI of Jaeger to make sure it is functioning properly.
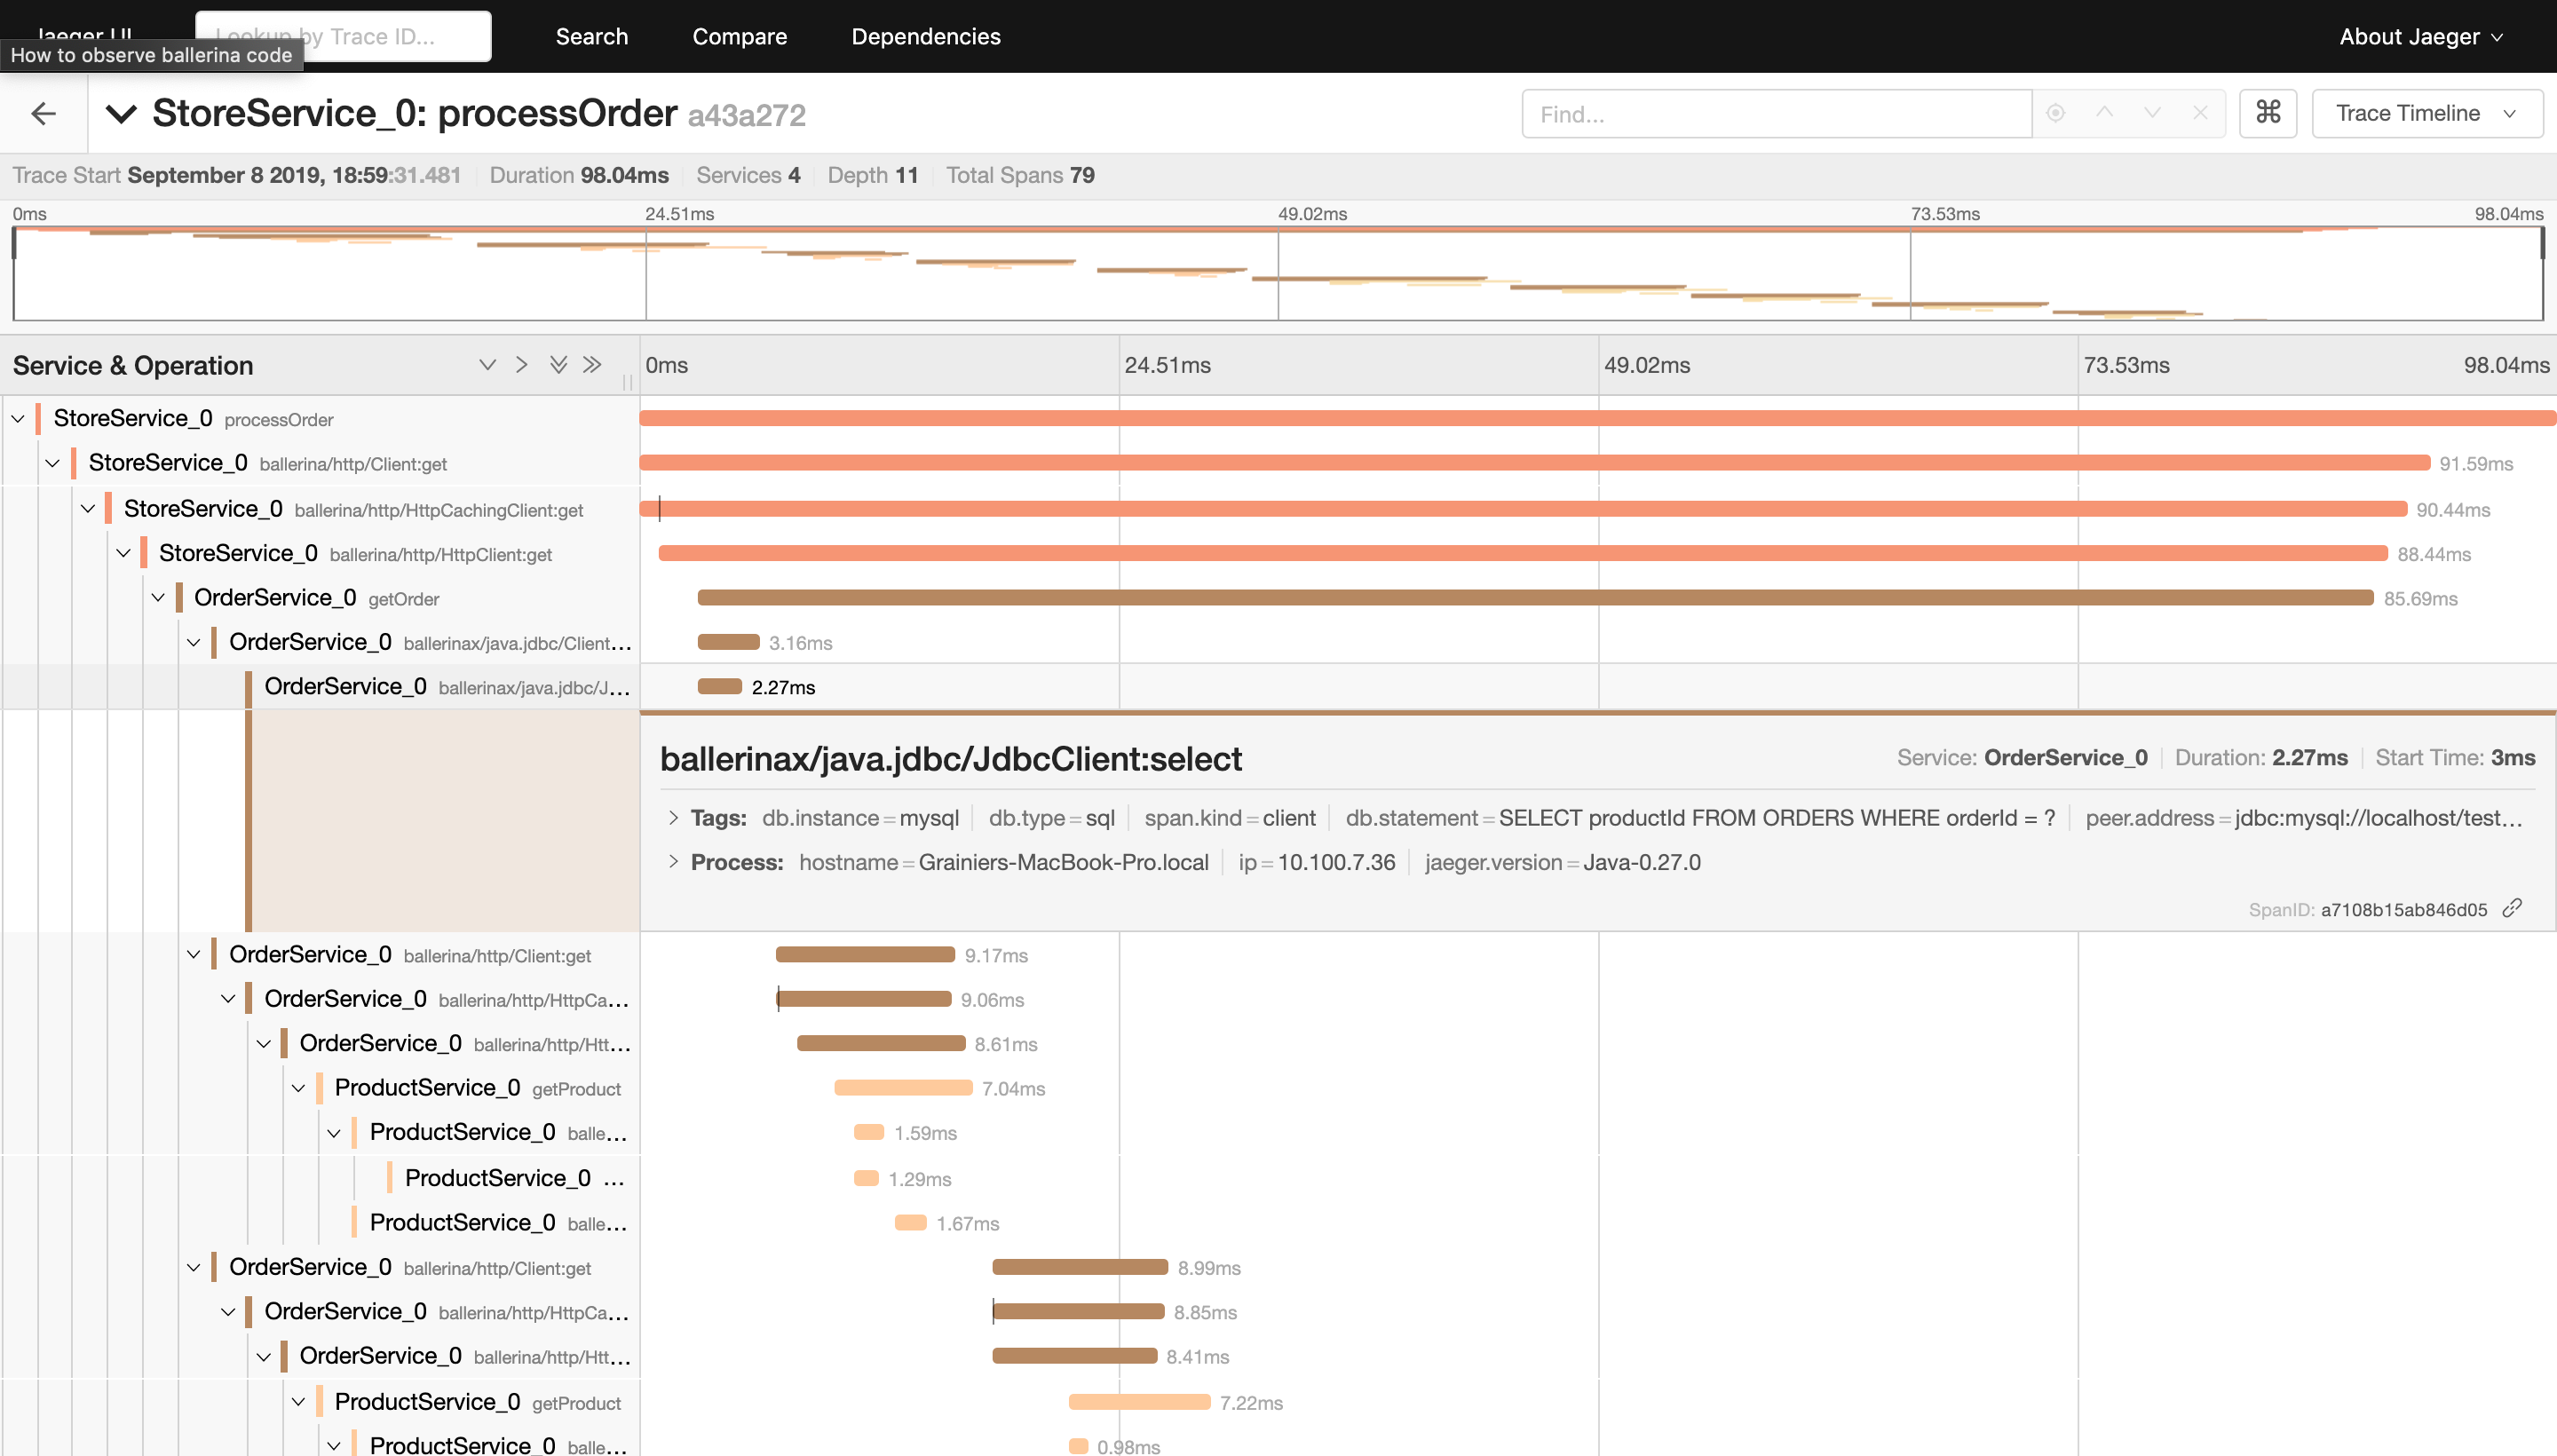
The image below is the sample tracing information you can see in Jaeger.
Distributed logging
In Ballerina, distributed logging and analysis are supported by the Elastic Stack. Ballerina has a log module for logging into the console. To monitor the logs, the Ballerina standard output needs to be redirected to a file.
This can be done by running the Ballerina service as below.
$ nohup bal run hello_world_service.bal > ballerina.log &
You can view the logs with the command below.
$ tail -f ~/wso2-ballerina/workspace/ballerina.log
Set up the external systems for log analytics
Set up Elastic Stack
The Elastic Stack comprises the following components.
- Beats - Multiple agents that ship data to Logstash or Elasticsearch. In our context, Filebeat will ship the Ballerina logs to Logstash. Filebeat should be a container running on the same host as the Ballerina service. This is so that the log file (ballerina.log) can be mounted to the Filebeat container.
- Logstash - Used to process and structure the log files received from Filebeat and send them to Elasticsearch.
- Elasticsearch - Storage and indexing of the logs sent by Logstash.
- Kibana - Visualizes the data stored in Elasticsearch.
Elasticsearch and Kibana are provided as Cloud Services. Alternatively, Docker containers can be used to set up Elasticsearch and Kibana as well.
-
Download the Docker images using the following commands.
# Elasticsearch Image $ docker pull docker.elastic.co/elasticsearch/elasticsearch:6.5.1 # Kibana Image $ docker pull docker.elastic.co/kibana/kibana:6.5.1 # Filebeat Image $ docker pull docker.elastic.co/beats/filebeat:6.5.1 # Logstash Image $ docker pull docker.elastic.co/logstash/logstash:6.5.1 -
Start Elasticsearch and Kibana containers by executing the following commands.
 $ docker run -p 9200:9200 -p 9300:9300 -it -h elasticsearch --name elasticsearch docker.elastic.co/elasticsearch/elasticsearch:6.5.1
 $ docker run -p 5601:5601 -h kibana --name kibana --link elasticsearch:elasticsearch docker.elastic.co/kibana/kibana:6.5.1
If you are using Linux, you may have to increase the
vm.max_map_countfor the Elasticsearch container to start. Execute the following command to do that.$ sudo sysctl -w vm.max_map_count=262144 -
Create a
logstash.conffile in the/tmp/pipeline/directory and include the following content in the file.input { beats { port => 5044 } } filter { grok { match => { "message" => "%{TIMESTAMP_ISO8601:date}%{SPACE}%{WORD:logLevel}%{SPACE}\[%{GREEDYDATA:module}\]%{SPACE}\-%{SPACE}%{GREEDYDATA:logMessage}"} } } output { elasticsearch { hosts => "elasticsearch:9200" index => "ballerina" document_type => "ballerina_logs" } }Here, the 3 stages are specified in the pipeline. Input is specified as beats and listens to port 5044. A Grok filter is used to structure the Ballerina logs and the output is specified to push to Elasticsearch on
elasticsearch:9200. -
Start the Logstash container by executing the following command.
$ docker run -h logstash --name logstash --link elasticsearch:elasticsearch -it --rm -v /tmp/pipeline:/usr/share/logstash/pipeline/ -p 5044:5044 docker.elastic.co/logstash/logstash:6.5.1 -
Configure Filebeat to ship the Ballerina logs. Create a
filebeat.ymlfile in the/tmp/directory and include the following content in the file.filebeat.prospectors: - type: log paths: - /usr/share/filebeat/ballerina.log output.logstash: hosts: ["logstash:5044"] -
Start the Filebeat container with the following command.
$ docker run -v /tmp/filebeat.yml:/usr/share/filebeat/filebeat.yml -v /<path-to-ballerina.log>/ballerina.log:/usr/share/filebeat/ballerina.log --link logstash:logstash docker.elastic.co/beats/filebeat:6.5.1The
-vflag is used for bind mounting, where the container will read the file from the host machine. Provide the path to theballerina.logfile to be bind-mounted to the filebeat container. -
Access Kibana to visualize the logs at http://localhost:5601. Add an index named
ballerinaand click onDiscoverto visualize the logs.


