An official website of the United States government
An official website of the United States government
The .gov means it's official.
Federal government websites often end in .gov or .mil. Before sharing sensitive information,
make sure you're on a federal government site.
The site is secure.
The
https:// ensures that you are connecting to the official website and that any
information you provide is encrypted and transmitted securely.

June 01, 2022
Nonfarm payroll employment increased in 49 states and the District of Columbia and was essentially unchanged in 1 state for the year ended April 2022. The largest percentage increase occurred in Nevada (8.0 percent), followed by Florida and Texas (5.9 percent each).
read full article »May 31, 2022

In 2021, labor productivity in the private nonfarm sector rose in 39 states and the District of Columbia. Output increased in all 50 states and the District of Columbia. Hours worked increased in all 50 states but declined in the District of Columbia. Washington and New Hampshire had the largest increases in labor productivity, 6.4 percent and 5.2 percent, respectively. Labor productivity also increased by more than 4.0 percent in the District of Columbia, California, and Tennessee.
May 27, 2022

Job openings rates increased in 8 states, decreased in 3 states, and were little changed in 39 states and the District of Columbia from the last business day of February 2022 to the last business day of March 2022. The national job openings rate was little changed, at 7.1 percent.
May 26, 2022
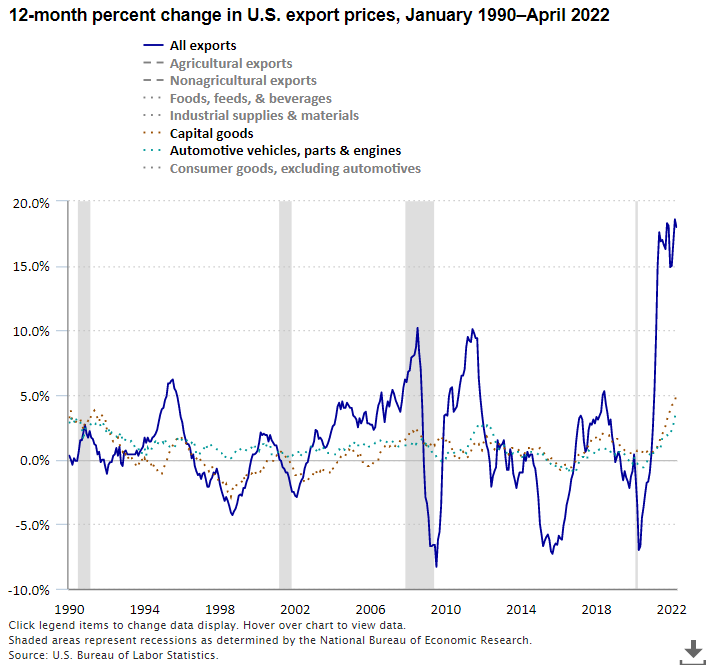
Prices for U.S. exports rose 18.0 percent from April 2021 to April 2022, following an increase of 18.6 percent in March 2022. Agricultural export prices increased 20.9 percent for the year ended April 2022, while nonagricultural export prices rose 17.6 percent.
May 25, 2022
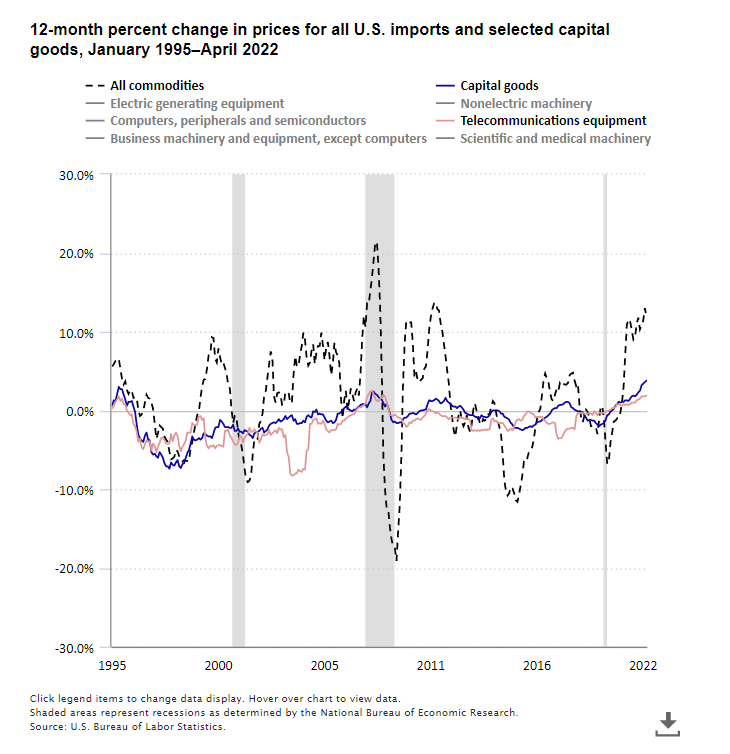
U.S. import prices rose 12.0 percent for the year ended in April 2022, down from the 13.0-percent increase for the year ended in March 2022. From April 2021 to April 2022, prices for import capital goods increased 3.8 percent, the largest over-the-year advance since September 1992.