l-ornithine activates Ca 2+ signaling to exert its protective function on human proximal tubular cells
- PMID: 31770578
- PMCID: PMC7302702
- DOI: 10.1016/j.cellsig.2019.109484
l-ornithine activates Ca 2+ signaling to exert its protective function on human proximal tubular cells
Abstract
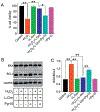
Oxidative stress and reactive oxygen species (ROS) generation can be influenced by G-protein coupled receptor (GPCR)-mediated regulation of intracellular Ca2+ ([Ca2+]i) signaling. ROS production are much higher in proximal tubular (PT) cells; in addition, the lack of antioxidants enhances the vulnerability to oxidative damage. Despite such predispositions, PT cells show resiliency, and therefore must possess some inherent mechanism to protect from oxidative damage. While the mechanism in unknown, we tested the effect of l-ornithine, since it is abundantly present in PT luminal fluid and can activate Ca2+-sensing receptor (CaSR), a GPCR, expressed in the PT luminal membrane. We used human kidney 2 (HK2) cells, a PT cell line, and performed Ca2+ imaging and electrophysiological experiments to show that l-ornithine has a concentration-dependent effect on CaSR activation. We further demonstrate that the operation of CaSR activated Ca2+ signaling in HK-2 cells mediated by the transient receptor potential canonical (TRPC) dependent receptor-operated Ca2+ entry (ROCE) using pharmacological and siRNA inhibitors. Since PT cells are vulnerable to ROS, we simulated such deleterious effects using genetically encoded peroxide-induced ROS production (HyperRed indicator) to show that the l-ornithine-induced ROCE mediated [Ca2+]i signaling protects from ROS production. Furthermore, we performed cell viability, necrosis and apoptosis assays, and mitochondrial oxidative gene expression to establish that presence of l-ornithine rescued the ROS-induced damage in HK-2 cells. Moreover, l-ornithine-activation of CaSR can reverse ROS production and apoptosis via mitogen-activated protein kinase p38 activation. Such nephroprotective role of l-ornithine can be useful as the translational option for reversing kidney diseases involving PT cell damage due to oxidative stress or crystal nephropathies.
Keywords: Ca(2+) signaling; Ca(2+)-sensing receptor; Cell death protection; Oxidative stress; Proximal tubular cells; l-Amino acids.
Published by Elsevier Inc.
Conflict of interest statement
CONFLICT OF INTERESTS
The authors declare that there is no conflict of interests.
Figures


Similar articles
-
Melamine induces Ca2+-sensing receptor activation and elicits apoptosis in proximal tubular cells.Am J Physiol Cell Physiol. 2017 Jul 1;313(1):C27-C41. doi: 10.1152/ajpcell.00225.2016. Epub 2017 Apr 5. Am J Physiol Cell Physiol. 2017. PMID: 28381520 Free PMC article.
-
Abrogation of store-operated Ca2+ entry protects against crystal-induced ER stress in human proximal tubular cells.Cell Death Discov. 2019 Aug 5;5:124. doi: 10.1038/s41420-019-0203-5. eCollection 2019. Cell Death Discov. 2019. PMID: 31396401 Free PMC article.
-
Evidence for a regulated Ca2+ entry in proximal tubular cells and its implication in calcium stone formation.J Cell Sci. 2019 Apr 30;132(9):jcs225268. doi: 10.1242/jcs.225268. J Cell Sci. 2019. PMID: 30910829 Free PMC article.
-
Canonical Transient Receptor Potential 6 Channel: A New Target of Reactive Oxygen Species in Renal Physiology and Pathology.Antioxid Redox Signal. 2016 Nov 1;25(13):732-748. doi: 10.1089/ars.2016.6661. Epub 2016 Mar 18. Antioxid Redox Signal. 2016. PMID: 26937558 Free PMC article. Review.
-
The roles of calcium-sensing receptor (CaSR) in heavy metals-induced nephrotoxicity.Life Sci. 2020 Feb 1;242:117183. doi: 10.1016/j.lfs.2019.117183. Epub 2019 Dec 23. Life Sci. 2020. PMID: 31874167 Review.
Cited by 4 articles
-
Hypercalciuria switches Ca2+ signaling in proximal tubular cells, induces oxidative damage to promote calcium nephrolithiasis.Genes Dis. 2021 May 15;9(2):531-548. doi: 10.1016/j.gendis.2021.04.006. eCollection 2022 Mar. Genes Dis. 2021. PMID: 35224165 Free PMC article.
-
Calcium Signaling Mediates Cell Death and Crosstalk with Autophagy in Kidney Disease.Cells. 2021 Nov 17;10(11):3204. doi: 10.3390/cells10113204. Cells. 2021. PMID: 34831428 Free PMC article. Review.
-
Tannic acid attenuates vascular calcification-induced proximal tubular cells damage through paracrine signaling.Biomed Pharmacother. 2021 Aug;140:111762. doi: 10.1016/j.biopha.2021.111762. Epub 2021 Jun 12. Biomed Pharmacother. 2021. PMID: 34126317
-
Olive Leaf Extract (OLE) impaired vasopressin-induced aquaporin-2 trafficking through the activation of the calcium-sensing receptor.Sci Rep. 2021 Feb 25;11(1):4537. doi: 10.1038/s41598-021-83850-5. Sci Rep. 2021. PMID: 33633156 Free PMC article.
Publication types
MeSH terms
Substances
Grant support
LinkOut - more resources
Full Text Sources
Miscellaneous

