The hippocampus is necessary for the consolidation of a task that does not require the hippocampus for initial learning
- PMID: 31157946
- PMCID: PMC6791729
- DOI: 10.1002/hipo.23101
The hippocampus is necessary for the consolidation of a task that does not require the hippocampus for initial learning
Abstract
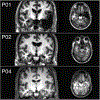
During sleep, the hippocampus plays an active role in consolidating memories that depend on it for initial encoding. There are hints in the literature that the hippocampus may have a broader influence, contributing to the consolidation of memories that may not initially require the area. We tested this possibility by evaluating learning and consolidation of the motor sequence task (MST) in hippocampal amnesics and demographically matched control participants. While the groups showed similar initial learning, only controls exhibited evidence of overnight consolidation. These results demonstrate that the hippocampus can be required for normal consolidation of a task without being required for its acquisition, suggesting that the area plays a broader role in coordinating memory consolidation than has previously been assumed.
Keywords: amnesics; memory; motor sequence learning; offline consolidation; sleep.
© 2019 Wiley Periodicals, Inc.
Figures


Similar articles
-
Sleep spindles: a physiological marker of age-related changes in gray matter in brain regions supporting motor skill memory consolidation.Neurobiol Aging. 2017 Jan;49:154-164. doi: 10.1016/j.neurobiolaging.2016.10.009. Epub 2016 Oct 11. Neurobiol Aging. 2017. PMID: 27815989
-
Sleep in Humans Stabilizes Pattern Separation Performance.J Neurosci. 2017 Dec 13;37(50):12238-12246. doi: 10.1523/JNEUROSCI.1189-17.2017. Epub 2017 Nov 8. J Neurosci. 2017. PMID: 29118106 Free PMC article.
-
The effects of sleep, wake activity and time-on-task on offline motor sequence learning.Neurobiol Learn Mem. 2016 Jan;127:56-63. doi: 10.1016/j.nlm.2015.11.009. Epub 2015 Dec 2. Neurobiol Learn Mem. 2016. PMID: 26655281
-
Sleep and motor learning: Is there room for consolidation?Psychol Bull. 2015 Jul;141(4):812-34. doi: 10.1037/bul0000009. Epub 2015 Mar 30. Psychol Bull. 2015. PMID: 25822130 Review.
-
Hippocampus and striatum: dynamics and interaction during acquisition and sleep-related motor sequence memory consolidation.Hippocampus. 2013 Nov;23(11):985-1004. doi: 10.1002/hipo.22183. Hippocampus. 2013. PMID: 23929594 Review.
Cited by 17 articles
-
Sleep deprivation and memory: Meta-analytic reviews of studies on sleep deprivation before and after learning.Psychol Bull. 2021 Nov;147(11):1215-1240. doi: 10.1037/bul0000348. Psychol Bull. 2021. PMID: 35238586 Free PMC article.
-
Slow oscillation-spindle coupling strength predicts real-life gross-motor learning in adolescents and adults.Elife. 2022 Feb 18;11:e66761. doi: 10.7554/eLife.66761. Elife. 2022. PMID: 35188457 Free PMC article.
-
Unsupervised Methods for Detection of Neural States: Case Study of Hippocampal-Amygdala Interactions.eNeuro. 2021 Nov 5;8(6):ENEURO.0484-20.2021. doi: 10.1523/ENEURO.0484-20.2021. Print 2021 Nov-Dec. eNeuro. 2021. PMID: 34544761 Free PMC article.
-
Sleep Leads to Brain-Wide Neural Changes Independent of Allocentric and Egocentric Spatial Training in Humans and Rats.Cereb Cortex. 2021 Oct 1;31(11):4970-4985. doi: 10.1093/cercor/bhab135. Cereb Cortex. 2021. PMID: 34037203 Free PMC article.
-
Sleep strengthens integration of spatial memory systems.Learn Mem. 2021 Apr 15;28(5):162-170. doi: 10.1101/lm.053249.120. Print 2021 May. Learn Mem. 2021. PMID: 33858969
Publication types
MeSH terms
Grant support
LinkOut - more resources
Full Text Sources

