Figure 1.
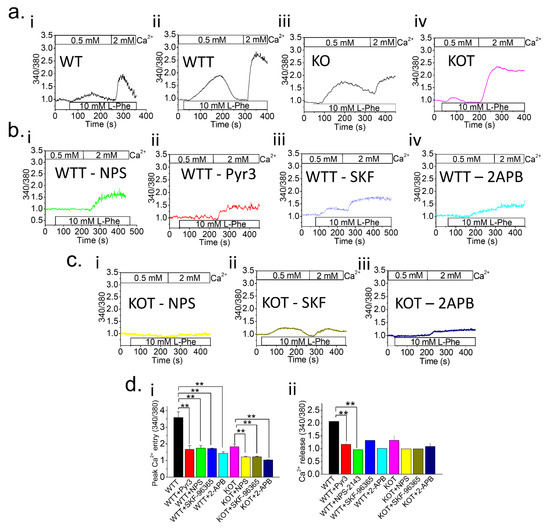
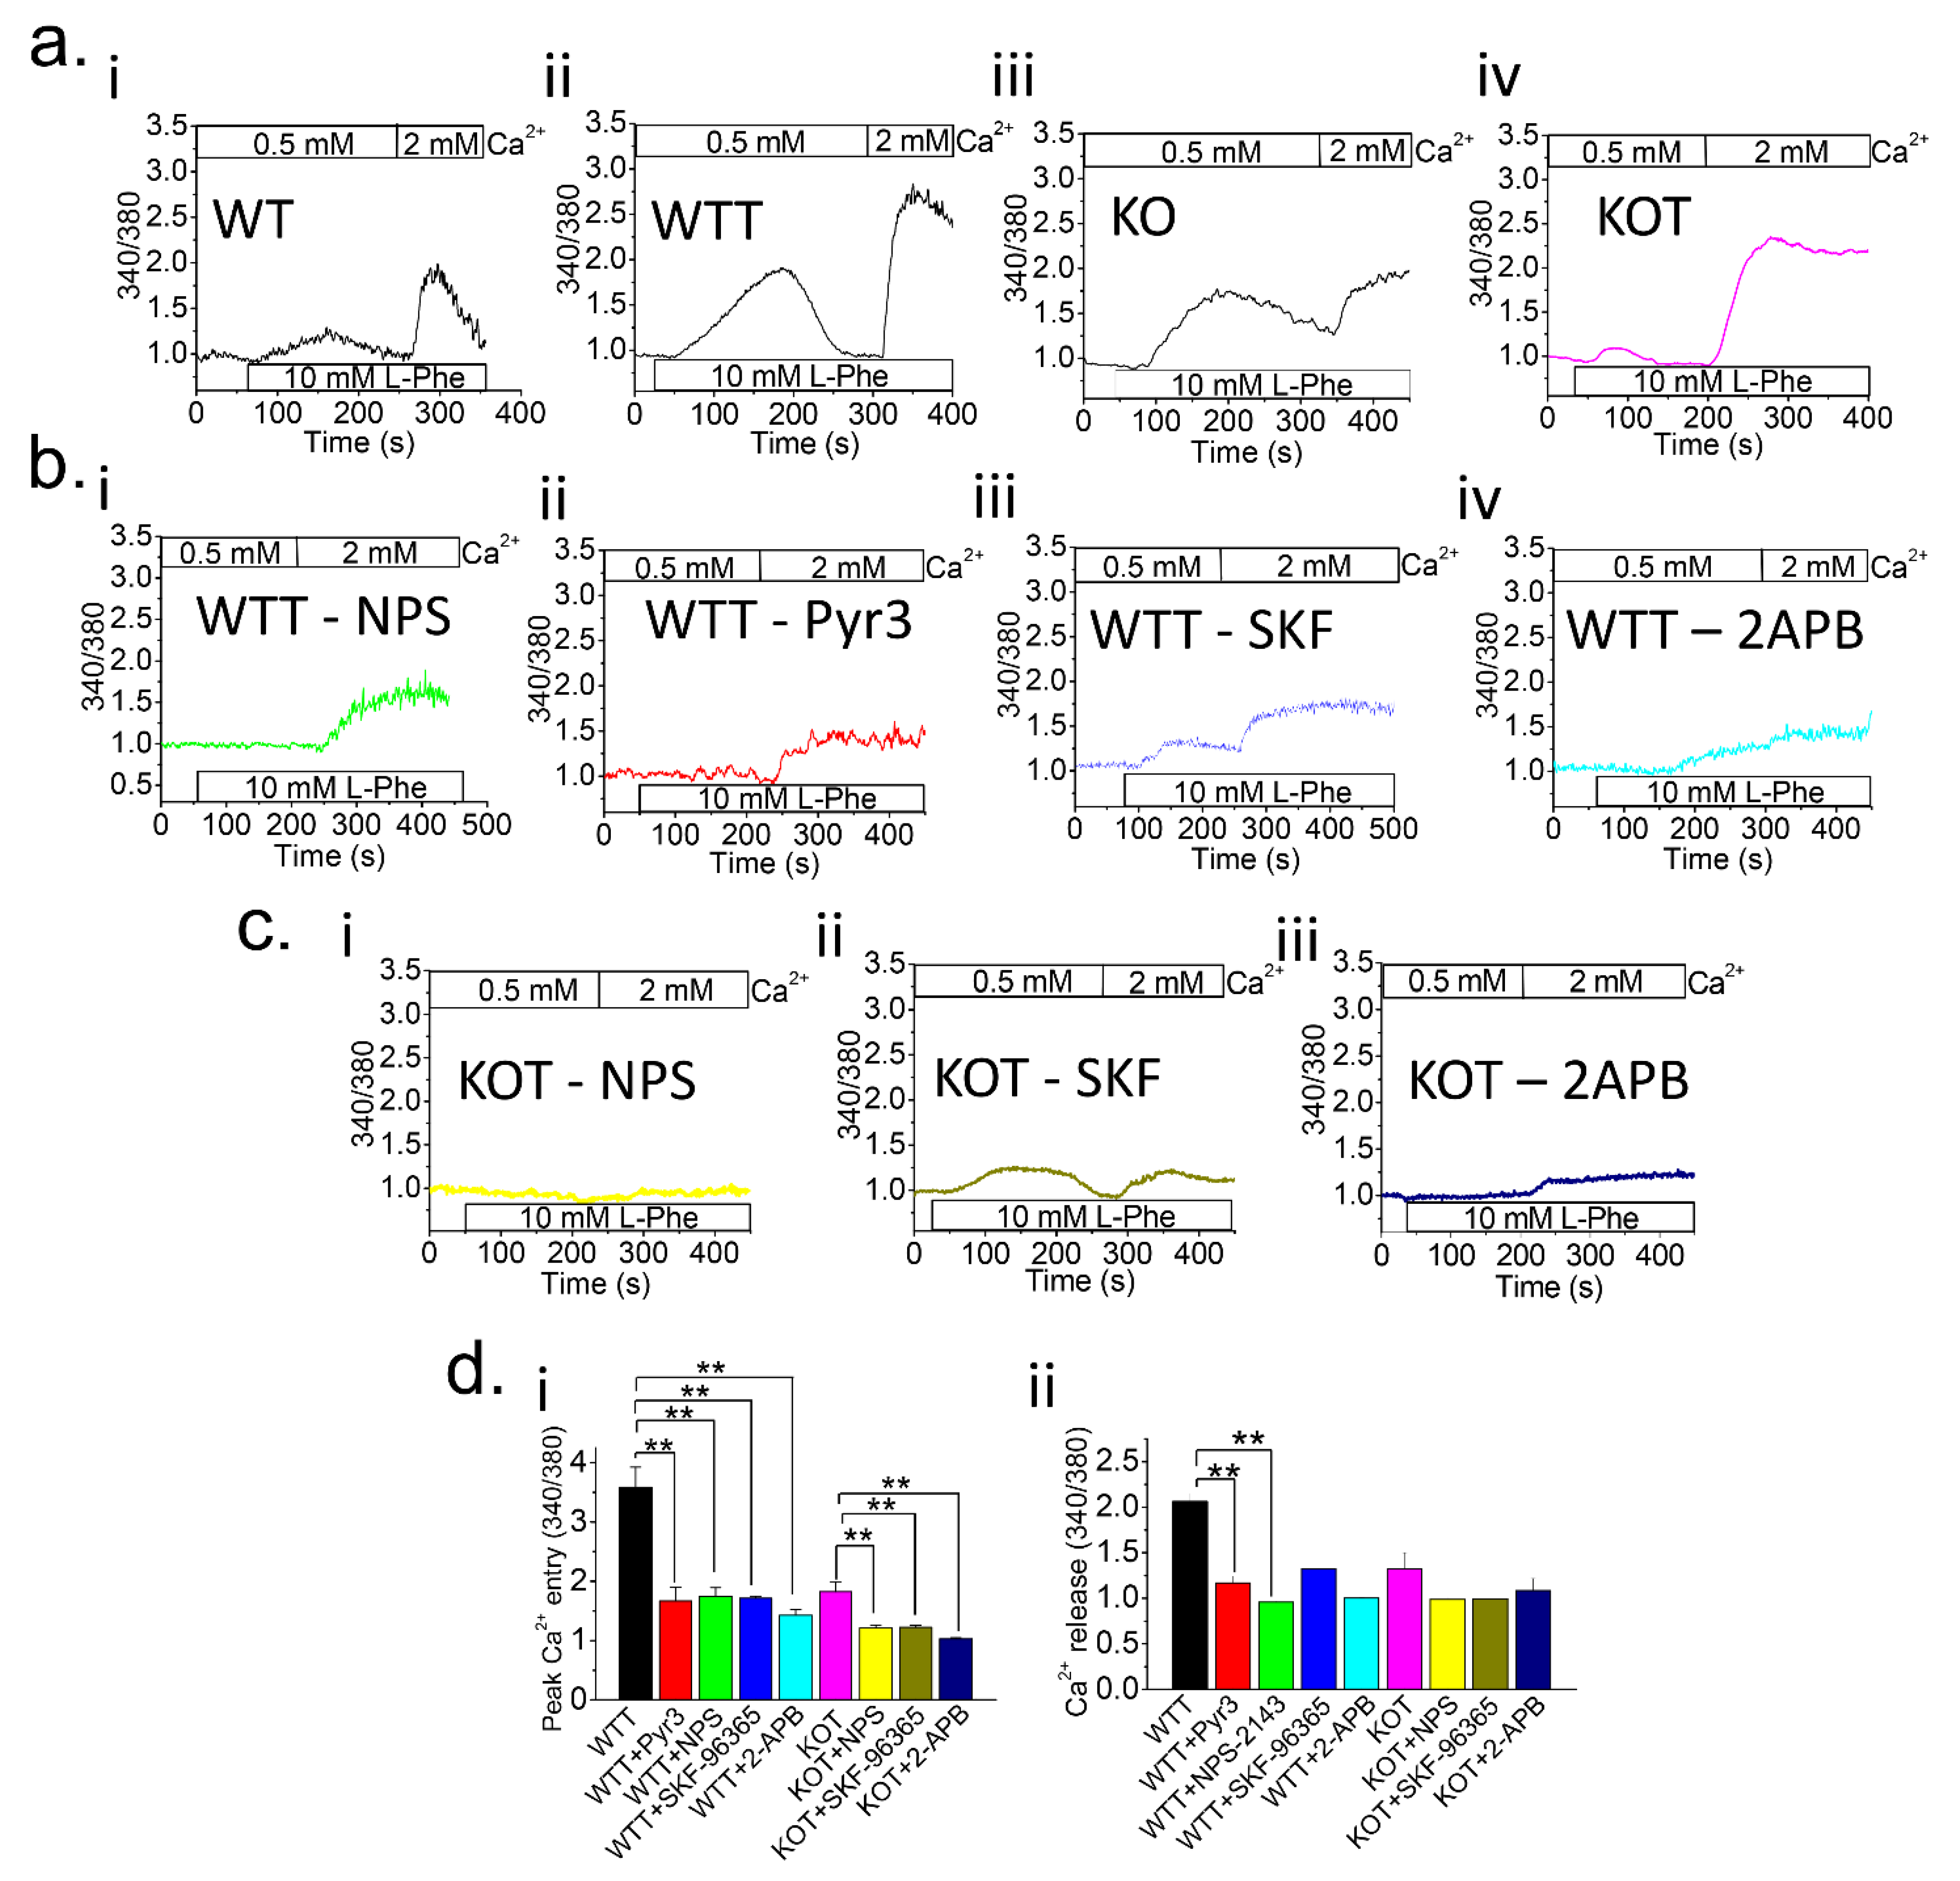
Higher luminal pH in TRPC KO PT cells enhances Ca2+ entry. [Ca2+]i measurements were performed on Fura-2 loaded (a) control PT cells and (b,c) PT cells with NPS-2143 (NPS; 1 μM), Pyr3 (3 μM), SKF-96365 (SKF; 10 μM) or 2-APB (12 μM) inhibitors from WT, Acz-treated WT (WTT), TRPC3-/- (KO), or Acz-treated KO (KOT) mice. Prior to experiments, PT cells were placed in 0.5 mM Ca2+ bath and L-Phenylalanine (L-Phe; 10 mM) was applied. Subsequently, 2 mM Ca2+ was applied to replenish [Ca2+]o. Fura-2 trace measurements were plotted for (ai) WT, (aii) WTT, (aiii) KO, and (aiv) KOT; WTT PT cells with (bi) NPS, (bii) Pyr3, (biii) SKF, and (biv) 2-APB inhibitors; and KOT PT cells with (ci) NPS, (cii) SKF, and (ciii) 2-APB inhibitors. (di,dii) Peak Ca2+ entry and Ca2+ release were quantified with representative bar diagrams in means ± SEM, respectively. Each experiment was performed four times. **, p < 0.01.
Figure 1.
Higher luminal pH in TRPC KO PT cells enhances Ca2+ entry. [Ca2+]i measurements were performed on Fura-2 loaded (a) control PT cells and (b,c) PT cells with NPS-2143 (NPS; 1 μM), Pyr3 (3 μM), SKF-96365 (SKF; 10 μM) or 2-APB (12 μM) inhibitors from WT, Acz-treated WT (WTT), TRPC3-/- (KO), or Acz-treated KO (KOT) mice. Prior to experiments, PT cells were placed in 0.5 mM Ca2+ bath and L-Phenylalanine (L-Phe; 10 mM) was applied. Subsequently, 2 mM Ca2+ was applied to replenish [Ca2+]o. Fura-2 trace measurements were plotted for (ai) WT, (aii) WTT, (aiii) KO, and (aiv) KOT; WTT PT cells with (bi) NPS, (bii) Pyr3, (biii) SKF, and (biv) 2-APB inhibitors; and KOT PT cells with (ci) NPS, (cii) SKF, and (ciii) 2-APB inhibitors. (di,dii) Peak Ca2+ entry and Ca2+ release were quantified with representative bar diagrams in means ± SEM, respectively. Each experiment was performed four times. **, p < 0.01.
Figure 2.
Ca2+ entry pathway in PT cells is contingent upon presence of TRPC3 in higher PT luminal pH conditions. Ratiometric [Ca2+]i measurements were performed and plotted on Fura-2 loaded PT cells from Acz treated mice (a) WT (WTT) and (b) KO (KOT) PT cells with no inhibitors (WTT Control or KOT Control), Pyr6 (3 μM), or Pyr10 (3 μM). Prior to experiments, PT cells were placed in a 0.5 mM Ca2+ bath and L-Phenylalanine (L-Phe; 10 mM) was applied. Subsequently, 2 mM Ca2+ was applied to replenish [Ca2+]o. (aii,bii) Peak Ca2+ release, (aiii,biii) Peak Ca2+ entry, and (aiv) Percent Ca2+ decline from entry were quantified into bar diagrams in means ± SEM. (c,d) Single cell patch clamp voltage sweeps from −100 to +100 mV were performed on WTT or KOT PT cell. L-Phe (10 mM) was applied to induce current and (ci,cii,di,dii) Pyr6 (3 μM) or (ciii,civ,diii,div) Pyr10 (3 μM) was applied as a current blocker. (cii,civ,dii,div,e) Average current density at +100 mV and L-Phe activated current inhibition percentage were quantitated into means ± SEM, respectively. Experiments were performed four times. *, p < 0.05; **, p < 0.01.

Figure 3.
NBCe1 expression and function are enhanced in TRPC3 KO PT cells in higher luminal pH conditions. (a) mRNA and (b) protein expressions of NBCe1 in PT cells from WT, Acz-treated WT (WTT), TRPC3 KO (KO) and Acz treated TRPC3 KO (KOT) mice were quantitated into bar diagrams. (c,d) Whole cell patch clamp voltage sweeps from −100 to +100 mV were quantitated into I-V curves and average current density at +100 mV was calculated. Bicarbonate (0.3 mM) was applied to induce current density and S0859 (50 μM) was applied as a current blocker. (a,b,ci,cii,di,dii) NBCe1 gene and protein expression, and average current density at +100 mV were quantitated into means ± SEM, respectively. (e) Percentage current density activation (bicarbonate) and inhibition (S0859), respectively, were quantitated into means ± SEM. Experiments were performed four times. *, p < 0.05. Gene and protein expressions are normalized to GAPDH and β-actin respectively.
Figure 4.
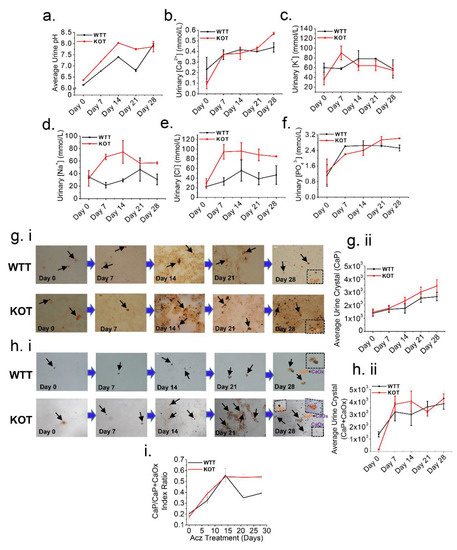
Higher luminal pH induced by Acz treatment induces CaP crystals formation. Representative line graphs of (a) Urine pH, urine electrolyte excretion levels (b) Ca2+, (c) K+, (d) Na+, (e) Cl− and (f) PO43−, collected on day 0, 7, 14, 21 and 28 of the treatment periods immediately after 24 h urine collection. (a,b) and (d–f) Urinary pH, Ca2+, Na+, Cl− and PO43− clearance progressively increased throughout the treatment period, particularly for the KOT group. (c) Urine K+ on the other hand showed a reduction in clearance for both the untreated and treated groups throughout the treatment period. All urine measurements were normalized by creatinine. (gi) Alizarin Red (AR) pH 4.3 (stains CaP crystals) and (hi) pH 6.8 (stains both CaOx and CaP+CaOx crystals) to differentially visualize calcium crystals present in the urine. Black arrows show urine crystals (CaP and CaP+CaOx). (gii,hii) representative line graphs for both WTT and KOT groups showing progressive increase in CaP and CaP+CaOx urine crystals respectively following Acz treatment. (i) CaP to CaP/CaOx index ratios throughout Acz treatment period which compared WTT and KOT mice groups were quantitated into means ± SEM. Experiments performed n = 4 times.
Figure 4.
Higher luminal pH induced by Acz treatment induces CaP crystals formation. Representative line graphs of (a) Urine pH, urine electrolyte excretion levels (b) Ca2+, (c) K+, (d) Na+, (e) Cl− and (f) PO43−, collected on day 0, 7, 14, 21 and 28 of the treatment periods immediately after 24 h urine collection. (a,b) and (d–f) Urinary pH, Ca2+, Na+, Cl− and PO43− clearance progressively increased throughout the treatment period, particularly for the KOT group. (c) Urine K+ on the other hand showed a reduction in clearance for both the untreated and treated groups throughout the treatment period. All urine measurements were normalized by creatinine. (gi) Alizarin Red (AR) pH 4.3 (stains CaP crystals) and (hi) pH 6.8 (stains both CaOx and CaP+CaOx crystals) to differentially visualize calcium crystals present in the urine. Black arrows show urine crystals (CaP and CaP+CaOx). (gii,hii) representative line graphs for both WTT and KOT groups showing progressive increase in CaP and CaP+CaOx urine crystals respectively following Acz treatment. (i) CaP to CaP/CaOx index ratios throughout Acz treatment period which compared WTT and KOT mice groups were quantitated into means ± SEM. Experiments performed n = 4 times.
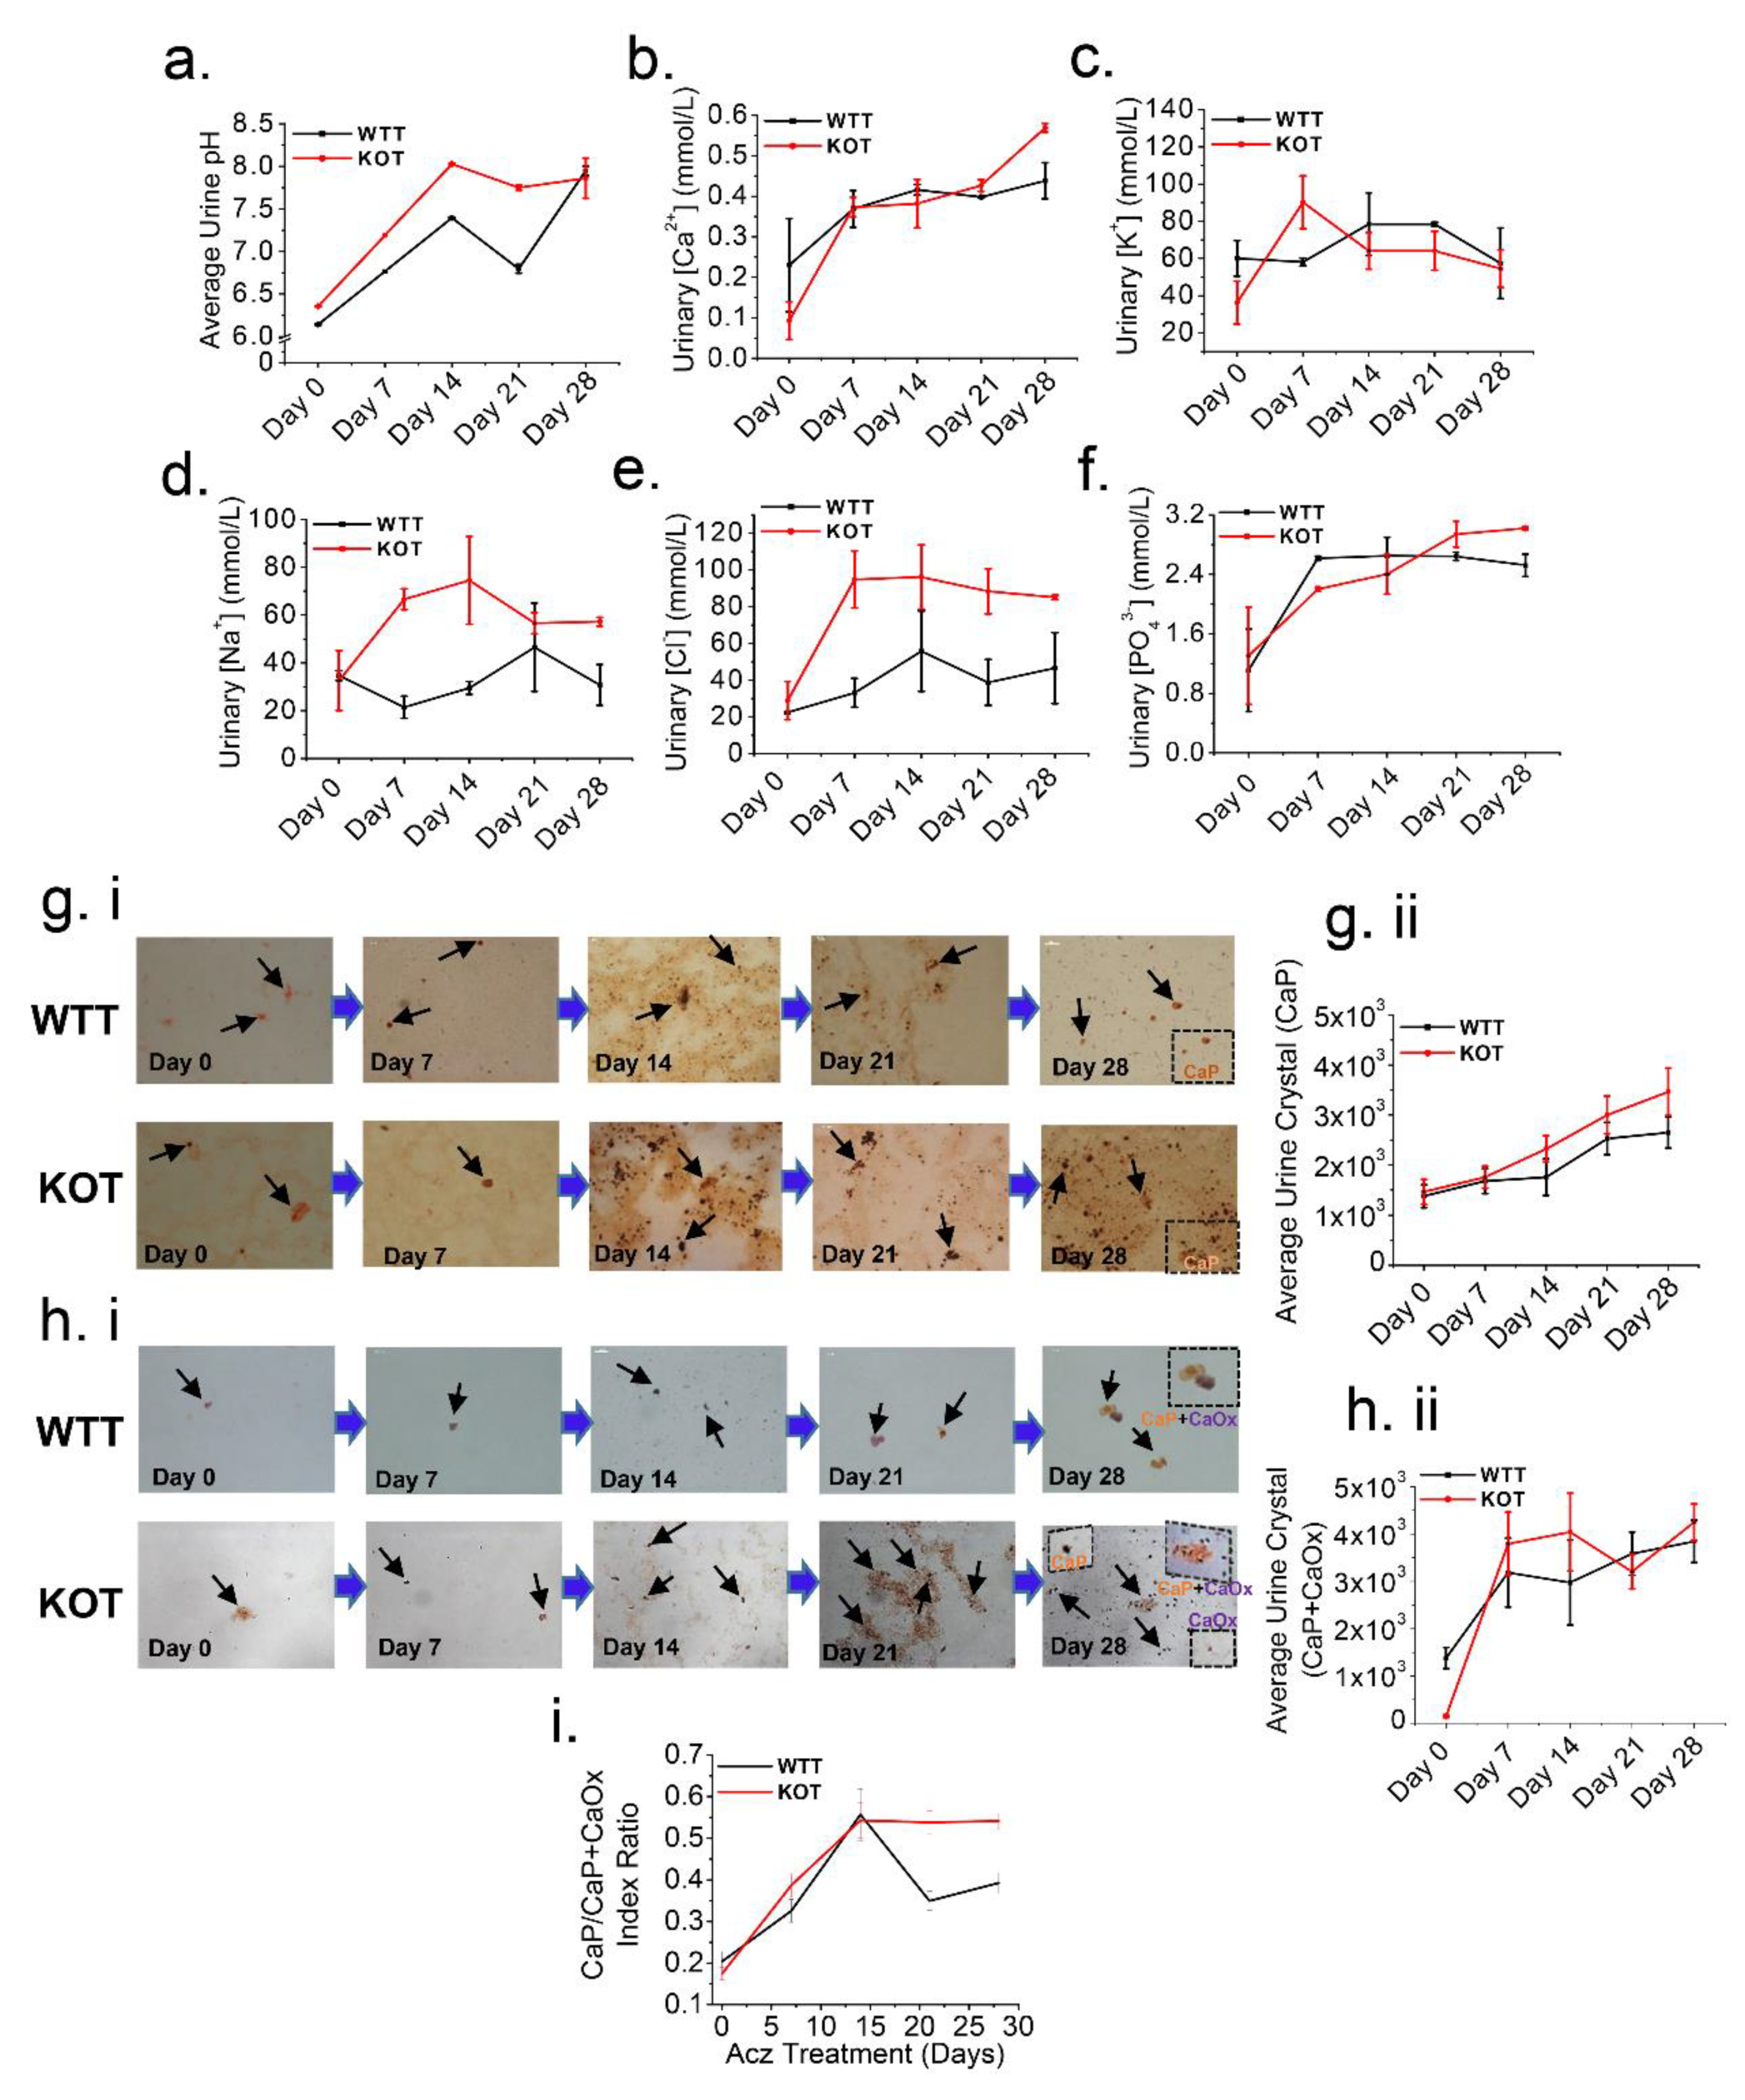
Figure 5.
Histological and molecular characterization of kidney calcification and stone formation following Acz treatment. Evidence of kidney calcification and stone formation by examining kidney tissues and its underlying molecular analysis through gene/protein expression of calcification markers. (a,b) Representative Von Kossa staining (for CaP) of whole kidney sections of WTT and KOT showing calcified regions of the kidney indicated by blue arrows. (c) Alizarin Red (AR) staining of whole WTT and KOT kidney sagittal sections of AR pH 4.3 staining shows CaP stones present in the LOH region of whole kidney while (d) AR pH 6.8 shows CaP+CaOx (mixed) stones in the calyx region of WTT and KOT whole kidney. Gene/Protein expression analysis providing evidence PT cell calcification in treated mice are shown by expression profiles of known calcification markers; (ei,eii) OCL, (fi,fii) OPN, (gi,gii) RUNX2 and (hi,hii) BMP2, which are significantly higher for the treated groups especially for KOT compared to the controls (WT and KO), except for (ii,iii) BMP6 which did not show any significant difference between the treated and untreated groups. (e–i) Bar graphs quantifications are means ± SEM, (n = 3); **, p < 0.01. All gene and protein expressions are normalized to GAPDH and β-actin respectively.

Figure 6.
Histological and molecular characterization of kidneys for fibrosis and inflammation following Acz treatment. Supportive evidence of Acz-induced fibrotic and inflammatory induction with of expressions of genetic markers of fibrosis and inflammation in PT cells. (a) Representative H&E staining of KOT and WTT mice kidney sections showing regions of inflammation in the kidney. (b,c) WTT and KOT mice kidney sections of Masson’s Trichrome staining shows fibrotic regions of the kidney. Corroborative evidence through gene expression analysis for fibrotic and inflammatory markers (d) NFκβ, (e) MCP1, and (f) NLRP3 in WT, WTT, KO, and KOT mice PT cells which are significantly higher in the treated groups especially for KOT, compared to the controls. Genetic expression profiles of (g) IL-6, (h) 1L-1β, (i) SMα, (j) TGFβ and (k) FN-1 in WT, WTT, KO, KOT mice PT cells; except in TGFβ and FN-1, KOT groups yielded higher expressions. (d–k) Bar graphs are means ± SEM from three separate experiments. *, p < 0.05; **, p < 0.01. All gene expressions are normalized to GAPDH.
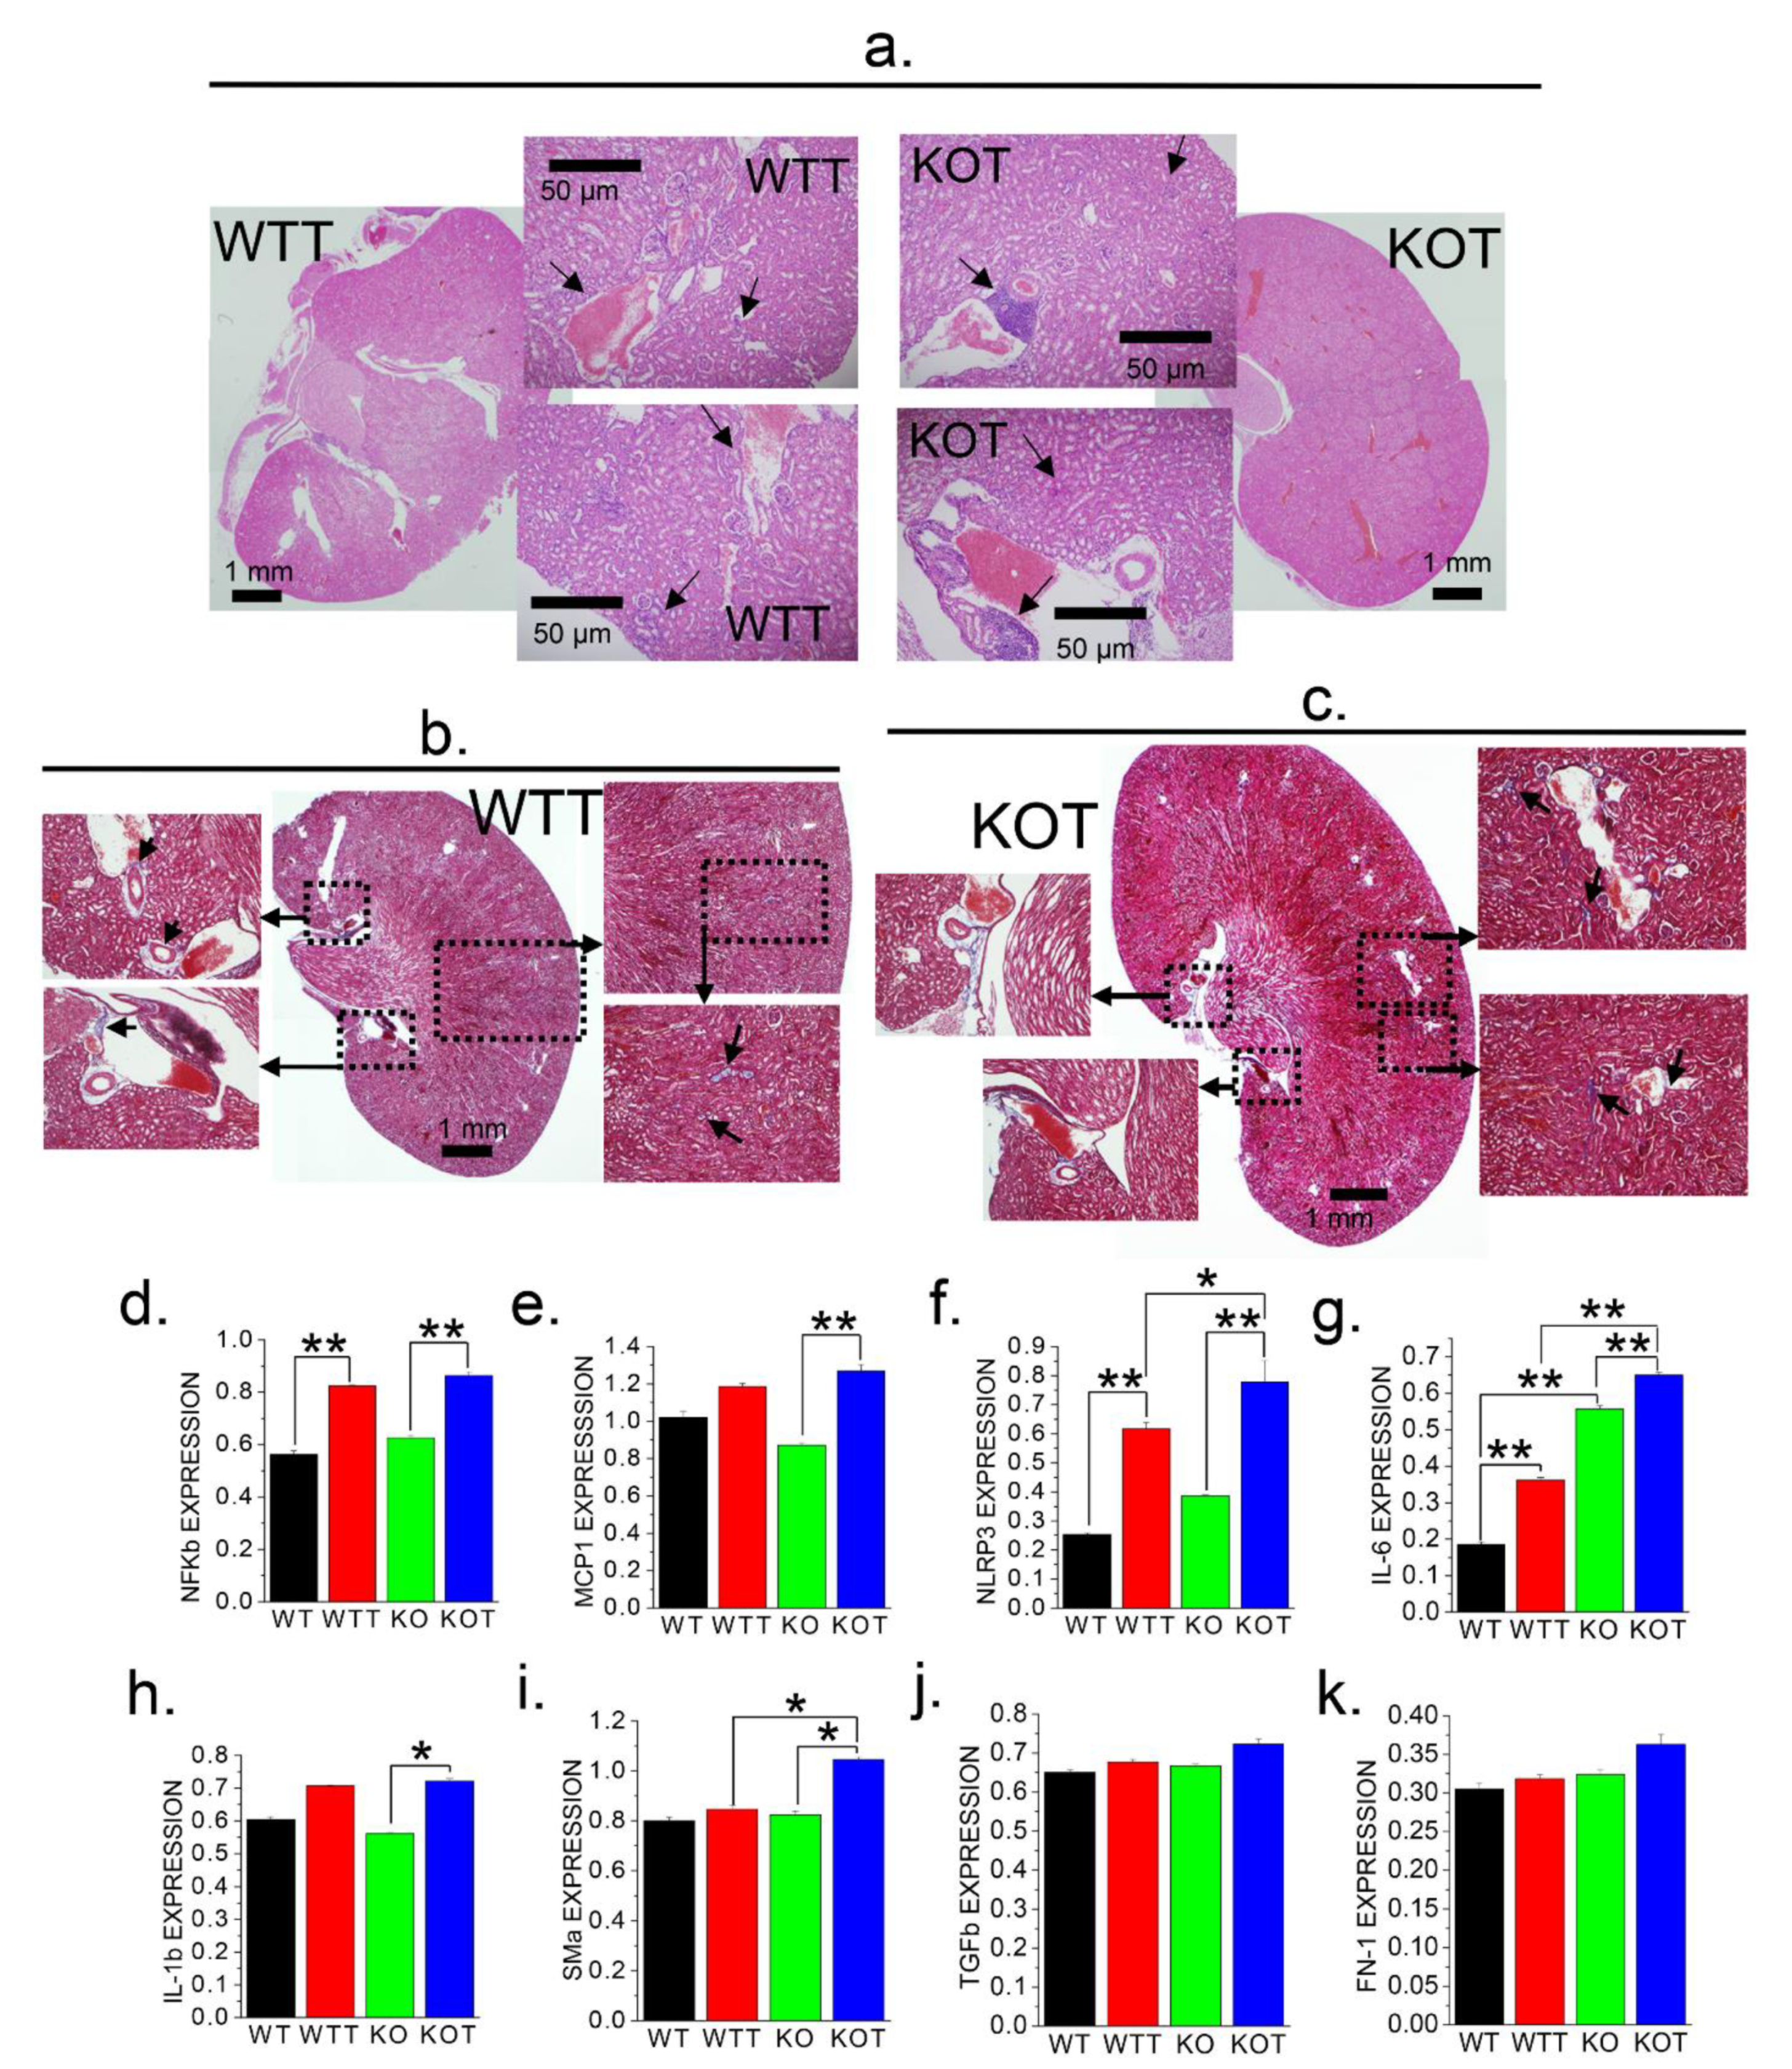
Figure 7.
Higher luminal pH induced by Acz increases oxidative stress and promote ER stress-induced apoptosis. Genetic expressions of oxidative stress markers (a) FMO2 and (b) NOX4, were assessed among WT, WTT, KO and KOT mice PT cells, which show oxidative stress gene, NOX4, expression was significantly increased in the KOT groups compared to all other groups analyzed. (c) GPX3 and (d) GPX6, markers for protection from oxidative stress, were significantly higher the KOT group compared to all other groups analyzed. Genetic and protein expression for apoptotic markers (ei,eii) BAX/BCL2 and (fi,fii) Caspase 3 and (g) Caspase 12 were significantly higher for all treated groups especially for KOT group compared to the controls (WT and KO). Evidence of endoplasmic reticulum (ER) stress following Acz treatment through genetic expression levels ER stress marker (h) M18S, assessed for WT, WTT, KO, and KOT mice PT cells where the ER stress gene was significantly expressed in the KOT group compared to all other groups analyzed. Experiments were performed three times. (a–h) Bar graphs are means ± SEM. *, p < 0.05; **, p < 0.01. All gene and protein expressions are normalized to GAPDH and β-Actin respectively.

Scheme 1.
Proposed mechanism of TRPC3-/- mouse proximal tubular cell in alkaline conditions following acetazolamide treatment. Proximal tubular (PT) cell of moderately hypercalciuric (TRPC3-/-) mice after inducing alkalization of tubular pH with Acz treatment. Mode of Ca2+ entry in PT cells switches from receptor-operated Ca2+ entry (ROCE) to store-operated Ca2+ entry (SOCE) after being subjected to alkaline conditions. This also prompts bicarbonate current activation, facilitation of renal tubular acidosis, and favorable conditions for calcium phosphate (CaP) crystal formation in the tubular lumen. Such luminal alkalization activates detrimental pathways in PT cells, including: ROS generation, calcification, inflammation, and fibrosis. In turn, increased ROS formation leads to ER stress and apoptosis towards PT cell injury. Cellular debris from PT cells can bind to CaP crystals and increase the risk of CaP/CaOx renal stone formation. Calcification markers are Osteocalcin 2 (OCL2), Osteopontin 4 (OPN-4), and Runt-related transcription factor 2 (RUNX2), and bone morphogenic protein (BMP) 2 and 6. Inflammation markers are NFkβ, MCP1, NLRP3 and Interleukins (IL): IL-1β, IL-6; and fibrotic markers are SMa, TGFβ1, and FN-1. Acz: acetazolamide; RTA: renal tubular acidosis; CaSR: calcium sensing receptor; CaP: calcium phosphate; CaOx: calcium oxalate; Gp: G-protein; ROS: reactive oxygen species; ROCE: receptor-operated Ca2+ entry; SOCE: store-operated Ca2+ entry; ER: endoplasmic reticulum.

Table 1.
PCR Primer information.
Table 1.
PCR Primer information.
| Primer | Sequence (Sense, Antisense) | Product Size (bp) |
|---|
| mGAPDH | 5′-ACTCCACTCACGGCAAATTC-3′ | 171 |
| 5′-TCTCCATGGTGGTGAAGACA-3′ |
| mNCX1 | 5′-CCTTGTGCATCTTAGCAATG-3′ | 309 |
| 5′-TCTCACTCATCTCCAGA-3′ |
| mPMCA1 | 5′TGGCAAACAACTCAGTTGCATATAGTGG3′ | 562 |
| 5′TCCTGTTCAATTCGACTCTGCAAGCCTCG3′ |
| mSMa | 5′-AGATTGTCCGTGACATCAAGG-3′ | 538 |
| 5′-TTGTGTGCTAGAGGCAGAGC-3 |
| mNBCe1 | 5′-CACTGAAAATGTGGAAGGGAA-3′ | 544 |
| 5′-TTATCACCCTTGTGCTTTGC-3′ |
| mNaPiIIa | 5′-AGACACAACAGAGGCTTC-3′ | 181 |
| 5′-CACAAGGAGGATAAGACAAG-3′ |
| mBMP2 | 5′-TGGAAGTGGCCCATTTAGAG-3′ | 166 |
| 5′-TGACGCTTTTCTCGTTTGTG-3′ |
| mBMP6 | 5′-CCCGCCCGGAGTAGTTTTAGC-3′ | 168 |
| 5′-AGTGCCCTTCTCCCCTCCATT-3′ |
| mOCL | 5′-CTGACAAAGCCTTCATGTCCAA-3′ | 59 |
| 5′-GCGCCGGAGTCTGTTCACTA-3′ |
| mOPN | 5′-GATGATGATGACGATGGAGACC-3′ | 148 |
| 5′-CGACTGTAGGGACGATTGGAG-3′ |
| mRUNX2 | 5′-CGGCCCTCCCTGAACTCT-3′ | 75 |
| 5′-TGCCTGCCTGGGATCTGTA-3′ |
| mTGFb | 5′-CTGAGTGGCTGTCTTTTG-3′ | 436 |
| 5′-TTGCTGTACTGTGTGTCC-3′ |
| mFN1 | 5′-TGCACGATGATATGGAGAGC-3′ | 93 |
| 5′-TGGGTGTCACCTGACTGA-3′ |
| mNLRP3 | 5′-AGAGCCTACAGTTGGGTGAAATG-3′ | 116 |
| 5′-CCACGCCTACCAGGAAATCTC-3′ |
| mIL-1b | 5′-TCCATGAGCTTTGTACAAGGA-3′ | 343 |
| 5′-AGCCCATACTTTAGGAAGACA-3′ |
| mIL-6 | 5′-TGGAGTCACAGAAGGAGTGGCTAA-3′ | 155 |
| 5′-TCTGACCACAGTGAGGAATGTCCA-3′ |
| mMCP1 | 5′-AGAGAGCCAGACGGGAGGAA-3′ | 520 |
| 5′-GTCACACTGGTCACTCCTAC-3′ |
| mNFkb | 5′-GTGGAGGCATGTTCGGTAGT-3′ | 367 |
| 5′-AGCTGCAGAGCCTTCTCAAG-3′ |
| mGPX3 | 5′-TGGCTTGGTCATTCTGGGC-3′ | 103 |
| 5′-CCCACCTGGTCGAACATACTT-3′ |
| mM18S | 5′-ACGGAAGGGCACCACCAGGA-3′ | 127 |
| 5′-CACCACCACCCACGGAATCG-3′ |
| mBAX | 5′-GAGACACCTGAGCTGACCTT-3′ | 244 |
| 5′-GCACCAGTTTGCTAGCAAAG-3′ |
| mBCL2 | 5′-CTCGTCGCTACCGTCGTGACTTCG-3′ | 242 |
| 5′-CAGAGTCCGGTTCAGGTACTCAGTC-3′ |
| mCaspase3 | 5′-AGAGAGCCAGACGGGAGGAA-3′ | 519 |
| 5′-GTCACACTGGTCACTCCTAC-3′ |
| mCaspase12 | 5′-GCTGGCCACATTGCCAATTCCC-3′ | 314 |
| 5′-GCCAGACGTGTTCGTCCCTCC-5′ |
| mGPX6 | 5′-GCCCAGAAGTTGTGGGGTTC-3′ | 129 |
| 5′-TCCATACTCATAGACGGTGCC-3′ |
| mSLC26a | 5′-AGATCTTCCTTGCGTCTGC-3′ | 149 |
| 5′-GCCTTTCCACATGGTAGTCTC-3′ |
Table 2.
Antibody information.
Table 2.
Antibody information.
| Antibody | Company Purchased/Ref. Number | Dilution Used |
|---|
| BAX1 | Santa Cruz Biotechnology; sc-20067 | 1:1000 |
| BCL2 | Santa Cruz Biotechnology; sc-23960 | 1:1000 |
| Caspase-3 | Santa Cruz Biotechnology; sc-7272 | 1:1000 |
| OPN | Santa Cruz Biotechnology; sc-10591 | 1:1000 |
| RUNX2 | Santa Cruz Biotechnology; sc-101145 | 1:1000 |
| BMP2 | Santa Cruz Biotechnology; sc-6895 | 1:1000 |
| BMP6 | Santa Cruz Biotechnology; sc-7406 | 1:1000 |
| OCL | Santa Cruz Biotechnology; sc-376726 | 1:1000 |
| Beta Actin | Santa Cruz Biotechnology; sc-47778 | 1:1000 |
| SLC4A4 (NBCe1) | Proteintech; 11885-1-AP | 1:1000 |


