-
Are my VPN tunnels up?
If your VPN tunnels are down, users may be unable to access network services that are critical to the business. NPM network monitoring software provides visibility into the health and performance of your entire Cisco ASA environment, so you can easily view the status of VPN tunnels to help ensure connectivity between sites.
-
Is it the app or the network?
When users report an error, it’s easy to jump to finger-pointing. Eliminate blame and ensure users have the services they need by understanding the critical network paths with Network Performance Monitor. NPM network monitoring is designed to show all devices, applications, networks, and vendors in single-page path analysis for more signal and less noise to quickly isolate network slowdowns.
-
What’s with the flood of alerts?
Alerts need to be informative and actionable. If you’re receiving so many that you can’t separate the signal from the noise, you might as well have no network monitoring alerts. With NPM network monitor, you can create alerts based on simple or complex nested trigger conditions, so your team can get meaningful information.
-
How do I keep up with a constantly changing network?
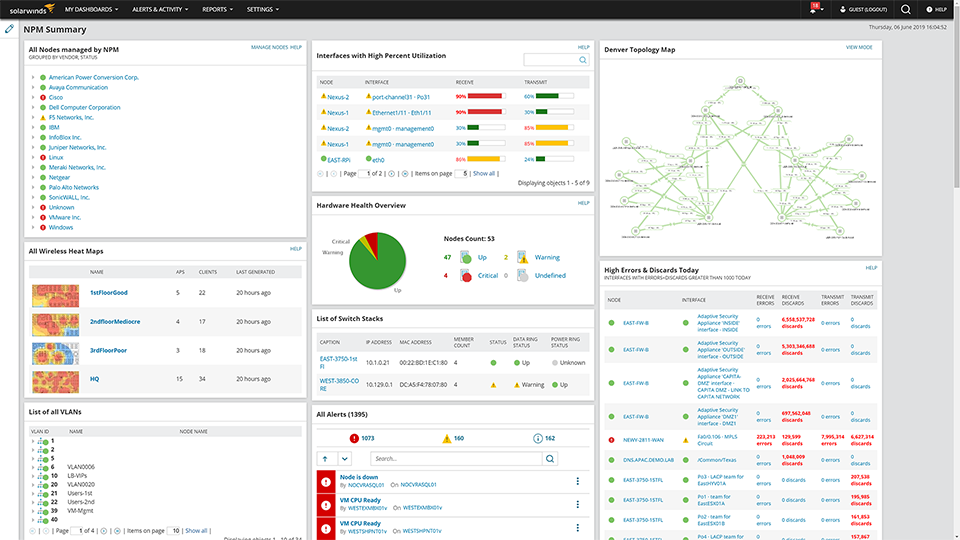
Visualization of data can be a powerful network monitor when put together in a meaningful way. The better you can visualize your environment, the easier it is to understand problems. Let auto-generating network visualization maps keep up with devices for you.
-
How do I monitor on-premises, private and public cloud networks in one tool?
As applications and services shift from on-prem to the cloud, organizations need a tool to provide visibility into shifting workloads and application performance all in one tool. NPM provides support for Microsoft Azure with visibility into site-to-site connections, client VPNs, and ExpressRoutes for VPN status and performance metrics. For private cloud visibility, NPM also supports Cisco ACI monitoring and troubleshooting.

-
Are my load balancers properly routing traffic?
Failures in load balancing can present as intermittent outages and be frustrating to troubleshoot. Using network performance monitoring in NPM, you can quickly isolate what’s contributing to a slowness or service outage. Monitor the health and performance of all components of application delivery.
-
How do I verify virtual port channel redundancy?
A problem on a vPC can mean you think you’re protected, but don’t have redundancy in place. The network performance monitoring tool in NPM is built to automatically map between vPCs, port channels, and physical ports across your Nexus switches to help ensure service availability.
If your VPN tunnels are down, users may be unable to access network services that are critical to the business. NPM network monitoring software provides visibility into the health and performance of your entire Cisco ASA environment, so you can easily view the status of VPN tunnels to help ensure connectivity between sites.
When users report an error, it’s easy to jump to finger-pointing. Eliminate blame and ensure users have the services they need by understanding the critical network paths with Network Performance Monitor. NPM network monitoring is designed to show all devices, applications, networks, and vendors in single-page path analysis for more signal and less noise to quickly isolate network slowdowns.
Alerts need to be informative and actionable. If you’re receiving so many that you can’t separate the signal from the noise, you might as well have no network monitoring alerts. With NPM network monitor, you can create alerts based on simple or complex nested trigger conditions, so your team can get meaningful information.
Visualization of data can be a powerful network monitor when put together in a meaningful way. The better you can visualize your environment, the easier it is to understand problems. Let auto-generating network visualization maps keep up with devices for you.
As applications and services shift from on-prem to the cloud, organizations need a tool to provide visibility into shifting workloads and application performance all in one tool. NPM provides support for Microsoft Azure with visibility into site-to-site connections, client VPNs, and ExpressRoutes for VPN status and performance metrics. For private cloud visibility, NPM also supports Cisco ACI monitoring and troubleshooting.

Failures in load balancing can present as intermittent outages and be frustrating to troubleshoot. Using network performance monitoring in NPM, you can quickly isolate what’s contributing to a slowness or service outage. Monitor the health and performance of all components of application delivery.
A problem on a vPC can mean you think you’re protected, but don’t have redundancy in place. The network performance monitoring tool in NPM is built to automatically map between vPCs, port channels, and physical ports across your Nexus switches to help ensure service availability.

- Connect with and correlate NetFlow, configuration, virtual, server, and application data to diagnose and resolve complex hybrid network performance issues.
- Get in-depth tools like PerfStack™, NetPath™, and Orion® Maps and allow users to gain insights from correlated data historically and in real time.
- Leverage the Orion Platform's modular structure to see all events and alerts on your network in one view and troubleshoot advanced devices across the platform.


