Troubleshooting  Edit
Edit
If you’re having trouble getting your JavaScript code to work, here are a few tips on how to find errors to help you troubleshoot.
Console Log Console Log
The console log is a JavaScript developer’s best friend. It is a good practice to work with it open, as it displays errors and notices in one place. See Mozilla’s JavaScript console documentation for more.
To open the JavaScript console, find the correct key combination for your broswer and OS:
| Browser | Windows | Linux | Mac |
|---|---|---|---|
| Firefox | Ctrl+Shift+K | Ctrl+Shift+K | Cmd+Opt+K |
| Chrome | Ctrl+Shift+J | Ctrl+Shift+J | Cmd+Opt+J |
| Edge | Ctrl+Shift+J | Ctrl+Shift+J | Cmd+Opt+J |
| Safari | Cmd+Opt+C |
First Step First Step
Your first step in debugging should be to check the JavaScript console for any errors. Here is an example, which shows a syntax error on line 6:

Display your message in console log Display your message in console log
You can also write directly to the console from your JavaScript code for debugging and checking variable values. Use the console.log function like so:
console.log( 'My message' );
Or if you want to include a message and variable, in this case display the contents of settings variable:
console.log( 'Settings value:', settings );
Using console log Using console log
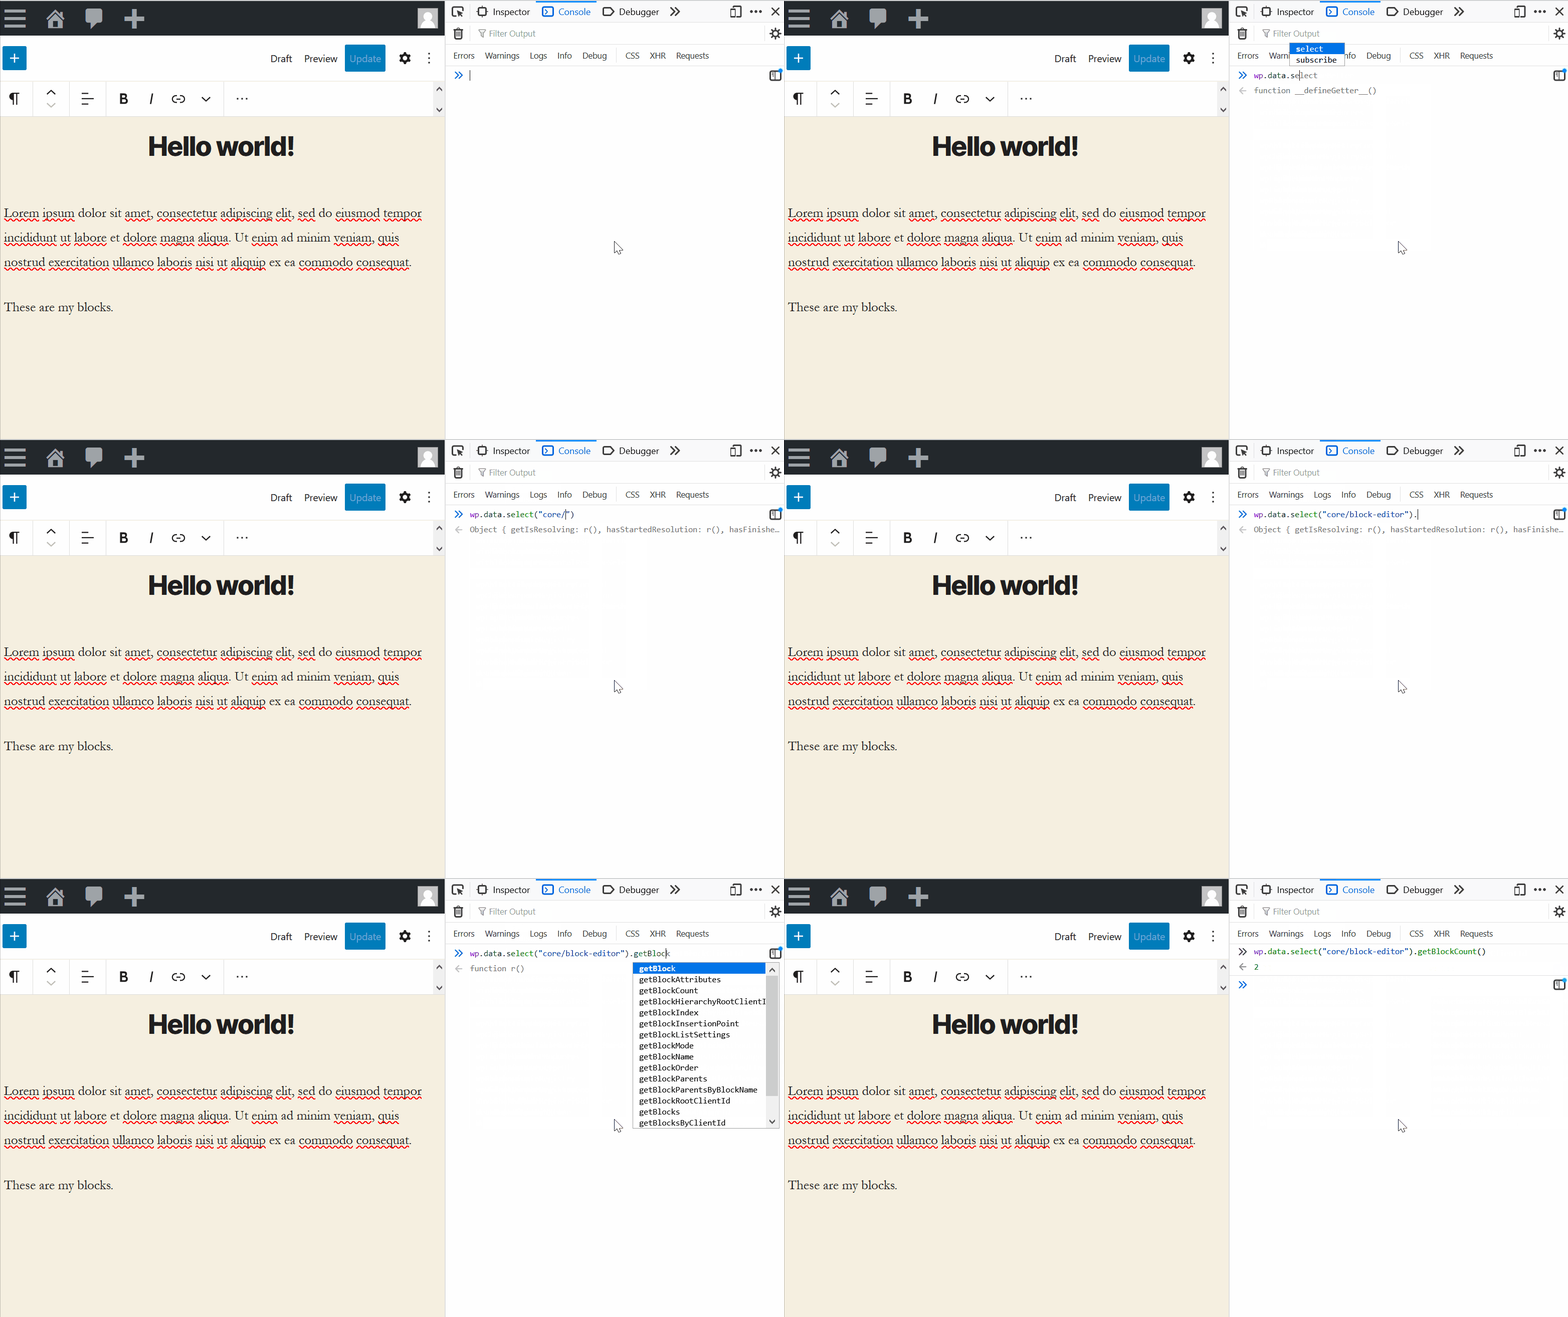
You can also write JavaScript directly in the console if you want to test a short command. The commands you run apply to the open browser window. Try this example with the wp.data package to count how many blocks are in the editor. Play with it and also try to use the console to browse available functions.
wp.data.select( 'core/block-editor' ).getBlockCount();

Using the debugger statement Using the debugger statement
If you would like to pause code execution at a certain line of code, you can write debugger; anywhere in your code. Once the browser sees the statement debugger;, it will pause execution of your code. This allows you to inspect all variables around the debugger statement, which is very useful. See this MDN page for more information.
Confirm JavaScript is loading Confirm JavaScript is loading
If you are not seeing your changes, and no errors, check that your JavaScript file is being enqueued. Open the page source in your browser’s web inspector (some browsers may allow you to view the page source by right clicking on the page and selecting “View Page Source”), and look for the <script> tag that loads your file. In the JavaScript tutorial example, you would search for myguten.js and confirm it is being loaded.
If you do not see the file being loaded, double check the enqueue function is correct. You can also check your server logs to see if there is an error messages.
Add a test message to confirm your JavaScript is loading, add a console.log("Here"); at the top of your code, and confirm the message is shown. If not, it is likely the file is not loading properly, review the loading JavaScript page for details on enqueuing JavaScript properly.
Confirm all dependencies are loading Confirm all dependencies are loading
The console log will show an error if a dependency your JavaScript code uses has not been declared and loaded in the browser. In the JavaScript tutorial example, if myguten.js script is enqueued without declaring the wp-blocks dependency, the console log will show:

You can correct by checking your wp_enqueue_script function includes all packages listed that are used:
wp_enqueue_script(
    'myguten-script',
    plugins_url( 'myguten.js', __FILE__ ),
    array( 'wp-blocks' )
);
For automated dependency management, it is recommended to use wp-scripts to build step your JavaScript.