Measure performance with the RAIL model
RAIL is a user-centric performance model that provides a structure for thinking about performance. The model breaks down the user's experience into key actions (for example, tap, scroll, load) and helps you define performance goals for each of them.
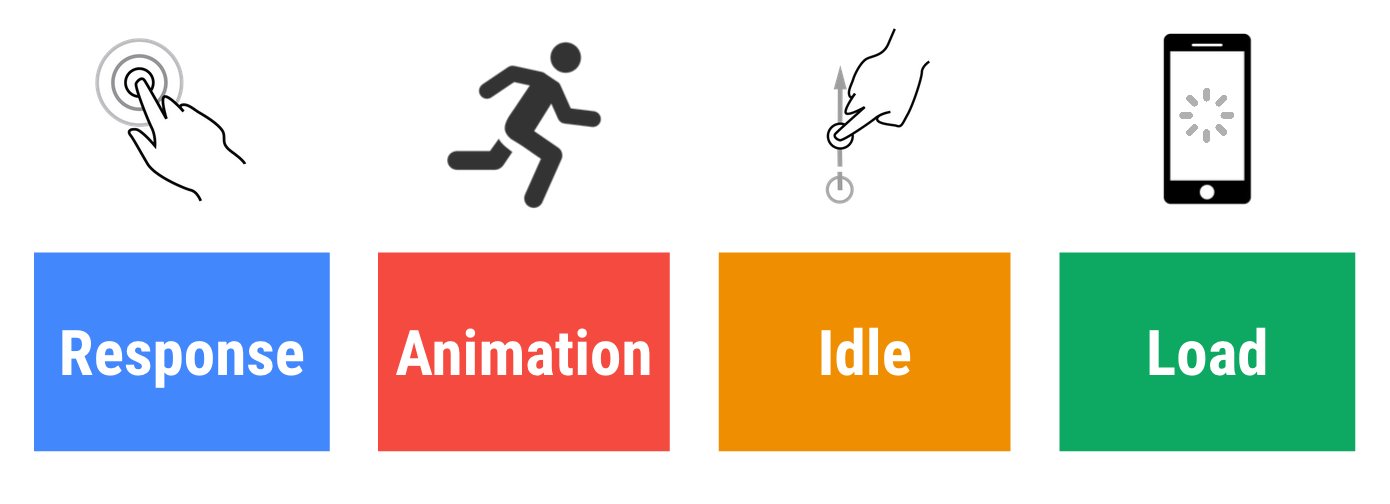
RAIL stands for four distinct aspects of web app life cycle: response, animation, idle, and load. Users have different performance expectations for each of these contexts, so performance goals are defined based on the context and UX research on how users perceive delays.
Focus on the user #
Make users the focal point of your performance effort. The table below describes key metrics of how users perceive performance delays:
| 0 to 16 ms | Users are exceptionally good at tracking motion, and they dislike it when animations aren't smooth. They perceive animations as smooth so long as 60 new frames are rendered every second. That's 16 ms per frame, including the time it takes for the browser to paint the new frame to the screen, leaving an app about 10 ms to produce a frame. |
| 0 to 100 ms | Respond to user actions within this time window and users feel like the result is immediate. Any longer, and the connection between action and reaction is broken. |
| 100 to 1000 ms | Within this window, things feel part of a natural and continuous progression of tasks. For most users on the web, loading pages or changing views represents a task. |
| 1000 ms or more | Beyond 1000 milliseconds (1 second), users lose focus on the task they are performing. |
| 10000 ms or more | Beyond 10000 milliseconds (10 seconds), users are frustrated and are likely to abandon tasks. They may or may not come back later. |
Users perceive performance delays differently, depending on network conditions and hardware. For example, loading sites on a powerful desktop machine over a fast Wi-Fi connection commonly happens in under 1 s and users have grown accustomed to that. Loading sites on mobile devices with slow 3G connections takes more time, so mobile users are generally more patient and loading in 5 s on mobile is a more realistic goal.
Goals and guidelines #
In the context of RAIL, the terms goals and guidelines have specific meanings:
Goals. Key performance metrics related to user experience. For example, tap to paint in under 100 milliseconds. Since human perception is relatively constant, these goals are unlikely to change any time soon.
Guidelines. Recommendations that help you achieve goals. These may be specific to current hardware and network connection conditions, and therefore may change over time.
Response: process events in under 50ms #
Goal: Complete a transition initiated by user input within 100 ms, so users feel like the interactions are instantaneous.
Guidelines:
To ensure a visible response within 100 ms, process user input events within 50 ms. This applies to most inputs, such as clicking buttons, toggling form controls, or starting animations. This does not apply to touch drags or scrolls.
Though it may sound counterintuitive, it's not always the right call to respond to user input immediately. You can use this 100 ms window to do other expensive work, but be careful not to block the user. If possible, do work in the background.
For actions that take longer than 50 ms to complete, always provide feedback.
50 ms or 100 ms? #
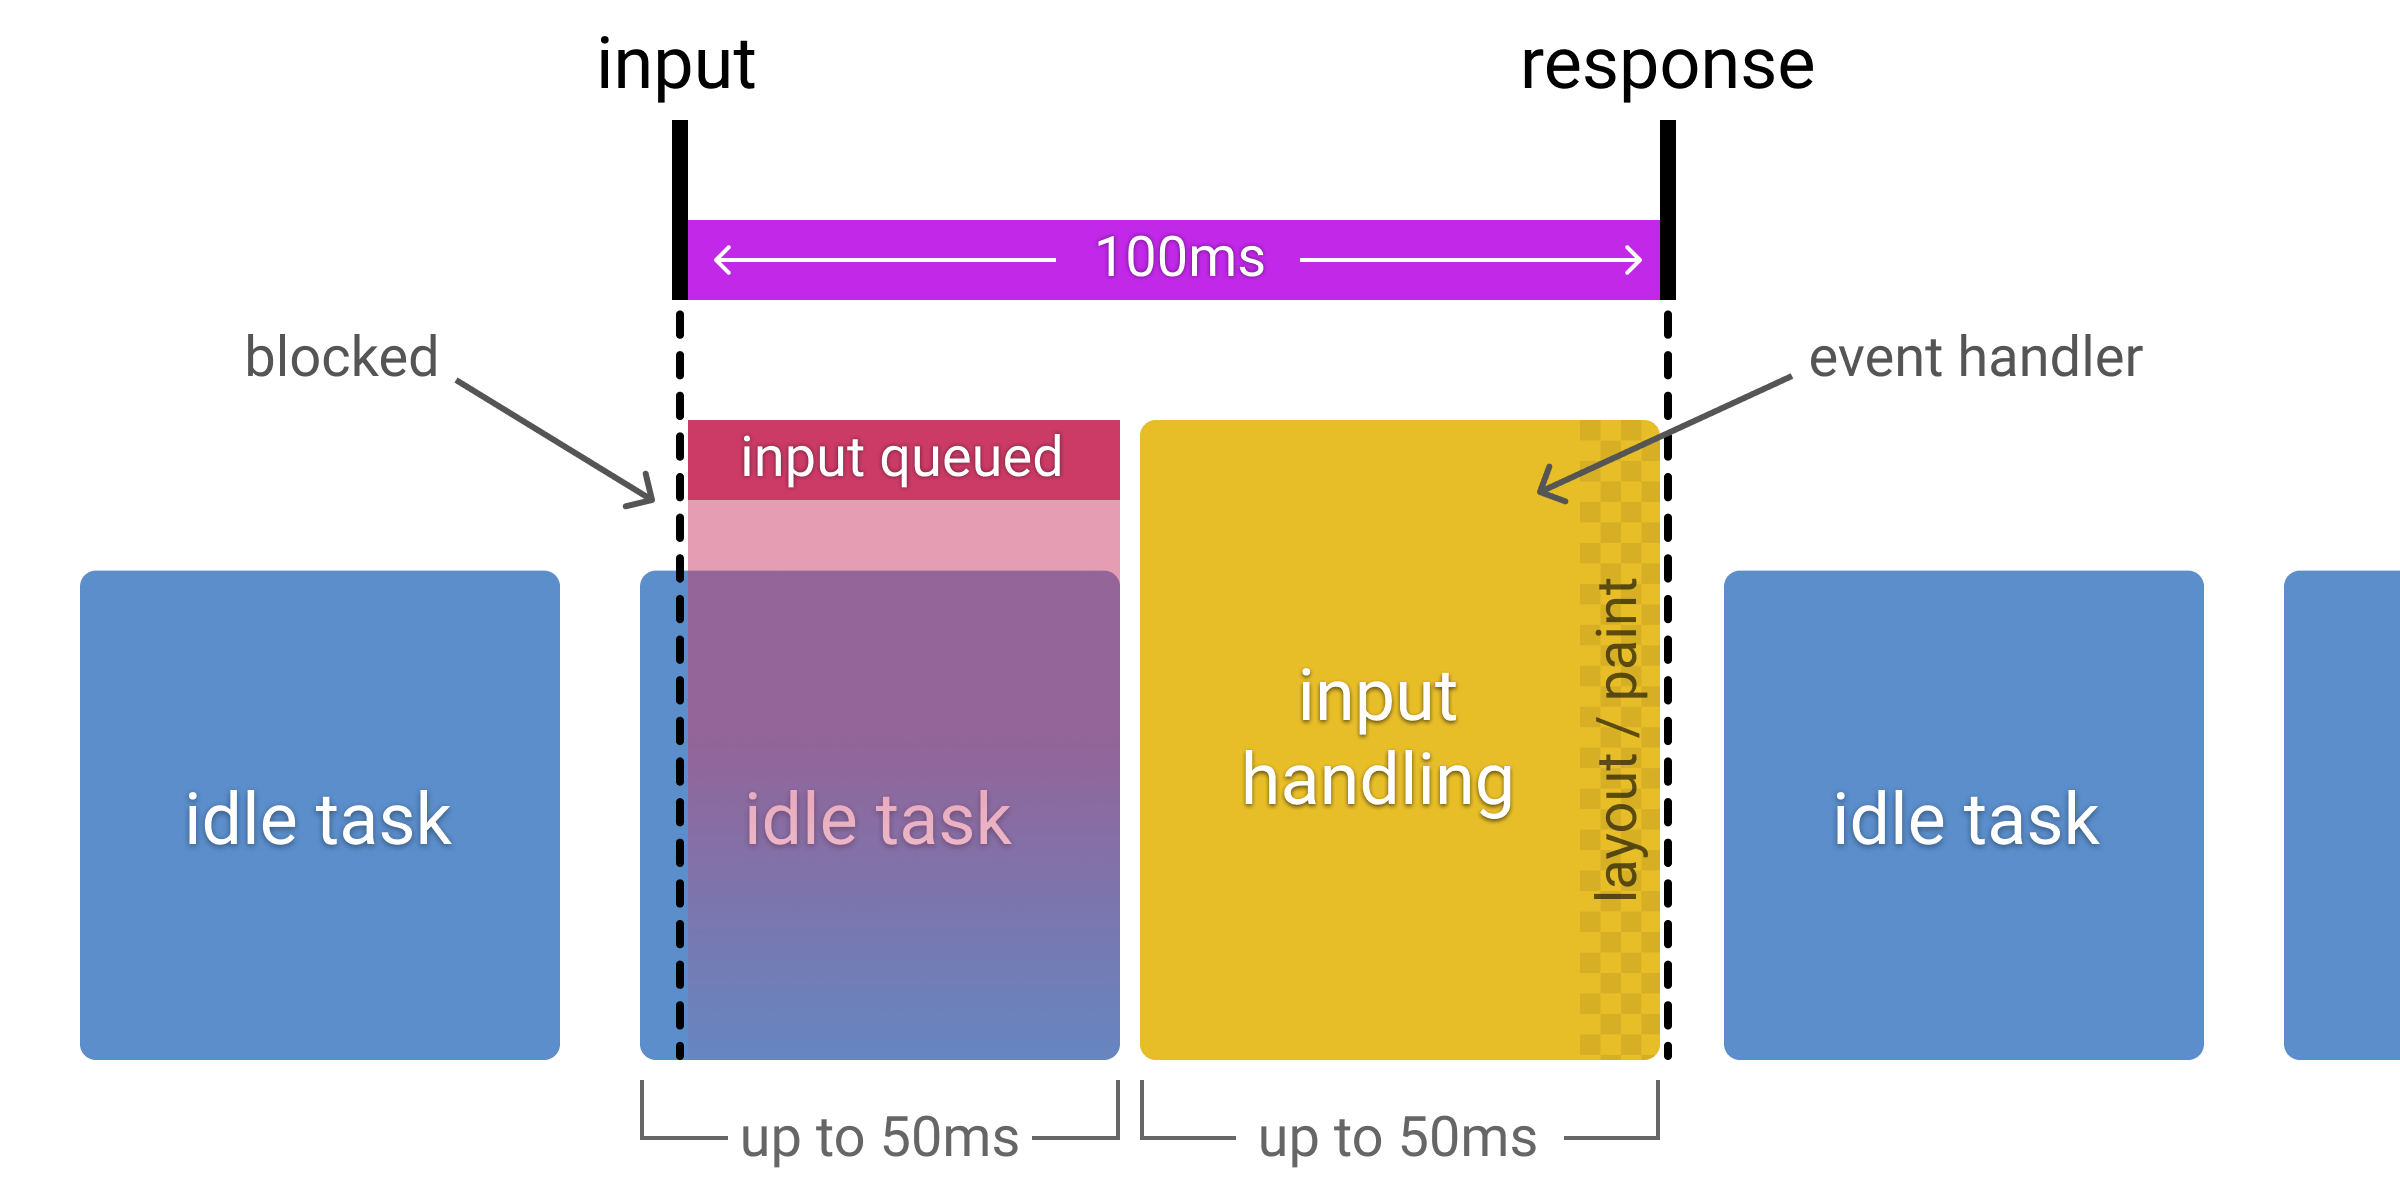
The goal is to respond to input in under 100 ms, so why is our budget only 50 ms? This is because there is generally other work being done in addition to input handling, and that work takes up part of the time available for acceptable input response. If an application is performing work in the recommended 50 ms chunks during idle time, that means input can be queued for up to 50 ms if it occurs during one of those chunks of work. Accounting for this, it's safe to assume only the remaining 50 ms is available for actual input handling. This effect is visualized in the diagram below which shows how input received during an idle task is queued, reducing the available processing time:
Animation: produce a frame in 10 ms #
Goals:
Produce each frame in an animation in 10 ms or less. Technically, the maximum budget for each frame is 16 ms (1000 ms / 60 frames per second ≈ 16 ms), but browsers need about 6 ms to render each frame, hence the guideline of 10 ms per frame.
Aim for visual smoothness. Users notice when frame rates vary.
Guidelines:
In high pressure points like animations, the key is to do nothing where you can, and the absolute minimum where you can't. Whenever possible, make use of the 100 ms response to pre-calculate expensive work so that you maximize your chances of hitting 60 fps.
See Rendering Performance for various animation optimization strategies.
Recognize all the types of animations. Animations aren't just fancy UI effects. Each of these interactions are considered animations:
- Visual animations, such as entrances and exits, tweens, and loading indicators.
- Scrolling. This includes flinging, which is when the user starts scrolling, then lets go, and the page continues scrolling.
- Dragging. Animations often follow user interactions, such as panning a map or pinching to zoom.
Idle: maximize idle time #
Goal: Maximize idle time to increase the odds that the page responds to user input within 50 ms.
Guidelines:
Use idle time to complete deferred work. For example, for the initial page load, load as little data as possible, then use idle time to load the rest.
Perform work during idle time in 50 ms or less. Any longer, and you risk interfering with the app's ability to respond to user input within 50 ms.
If a user interacts with a page during idle time work, the user interaction should always take the highest priority and interrupt the idle time work.
Load: deliver content and become interactive in under 5 seconds #
When pages load slowly, user attention wanders, and users perceive the task as broken. Sites that load quickly have longer average sessions, lower bounce rates, and higher ad viewability.
Goals:
Optimize for fast loading performance relative to the device and network capabilities of your users. Currently, a good target for first loads is to load the page and be interactive in 5 seconds or less on mid-range mobile devices with slow 3G connections.
For subsequent loads, a good target is to load the page in under 2 seconds.
Be aware that these targets may change over time.
Guidelines:
Test your load performance on the mobile devices and network connections that are common among your users. You can use Chrome User Experience Report to find out the connection distribution of your users. If the data is not available for your site, The Mobile Economy 2019 suggests that a good global baseline is a mid-range Android phone, such as a Moto G4, and a slow 3G network (defined as 400 ms RTT and 400 kbps transfer speed). This combination is available on WebPageTest.
Keep in mind that although your typical mobile user's device might claim that it's on a 2G, 3G, or 4G connection, in reality the effective connection speed is often significantly slower, due to packet loss and network variance.
You don't have to load everything in under 5 seconds to produce the perception of a complete load. Consider lazy-loading images, code-splitting JavaScript bundles, and other optimizations suggested on web.dev.
Recognize the factors that affect page load performance:
- Network speed and latency
- Hardware (slower CPUs, for example)
- Cache eviction
- Differences in L2/L3 caching
- Parsing JavaScript
Tools for measuring RAIL #
There are a few tools to help you automate your RAIL measurements. Which one you use depends on what type of information you need, and what type of workflow you prefer.
Chrome DevTools #
Chrome DevTools provides in-depth analysis on everything that happens while your page loads or runs. See Get Started With Analyzing Runtime Performance to get familiar with the Performance panel UI.
The following DevTools features are especially relevant:
Throttle your CPU to simulate a less-powerful device.
Throttle the network to simulate slower connections.
View main thread activity to view every event that occurred on the main thread while you were recording.
View main thread activities in a table to sort activities based on which ones took up the most time.
Analyze frames per second (FPS) to measure whether your animations truly run smoothly.
Monitor CPU usage, JS heap size, DOM nodes, layouts per second, and more in real-time with the Performance Monitor.
Visualize network requests that occurred while you were recording with the Network section.
Capture screenshots while recording to play back exactly how the page looked while the page loaded, or an animation fired, and so on.
View interactions to quickly identify what happened on a page after a user interacted with it.
Find scroll performance issues in real-time by highlighting the page whenever a potentially problematic listener fires.
View paint events in real-time to identify costly paint events that may be harming the performance of your animations.
Lighthouse #
Lighthouse is available in Chrome DevTools, at web.dev/measure, as a Chrome Extension, as a Node.js module, and within WebPageTest. You give it a URL, it simulates a mid-range device with a slow 3G connection, runs a series of audits on the page, and then gives you a report on load performance, as well as suggestions on how to improve.
The following audits are especially relevant:
Response
Max Potential First Input Delay. Estimates how long your app will take to respond to user input, based on main thread idle time.
Does not use passive listeners to improve scrolling performance.
Total Blocking Time. Measures the total amount of time that a page is blocked from responding to user input, such as mouse clicks, screen taps, or keyboard presses.
Time To Interactive. Measures when a user can consistently interact with all page elements.
Load
Does not register a service worker that controls page and start_url. A service worker can cache common resources on a user's device, reducing time spent fetching resources over the network.
Defer offscreen images. Defer the loading of offscreen images until they're needed.
Properly size images. Don't serve images that are significantly larger than the size that's rendered in the mobile viewport.
Avoid an excessive DOM size. Reduce network bytes by only shipping DOM nodes that are needed for rendering the page.
WebPageTest #
WebPageTest is a web performance tool that uses real browsers to access web pages and collect timing metrics. Enter a URL at webpagetest.org/easy to get a detailed report on the page's load performance on a real Moto G4 device with a slow 3G connection. You can also configure it to include a Lighthouse audit.
Summary #
RAIL is a lens for looking at a website's user experience as a journey composed of distinct interactions. Understand how users perceive your site in order to set performance goals with the greatest impact on user experience.
Focus on the user.
Respond to user input in under 100 ms.
Produce a frame in under 10 ms when animating or scrolling.
Maximize main thread idle time.
Load interactive content in under 5000 ms.