Tools to measure Core Web Vitals
Your favorite developer tools can now measure the Core Web Vitals.
The recently announced Web Vitals initiative provides unified guidance about quality signals that are essential for all sites to deliver a great user experience on the web. We're happy to announce that all of Google's popular tools for web developers now support measurement of Core Web Vitals, helping you more easily diagnose and fix user experience issues. This includes Lighthouse, PageSpeed Insights, Chrome DevTools, Search Console, web.dev's measure tool, the Web Vitals Chrome extension and a new (!) Chrome UX Report API.
With Google Search now including Core Web Vitals as the foundation for evaluating page experience, it's important that these metrics are as available and actionable as possible.
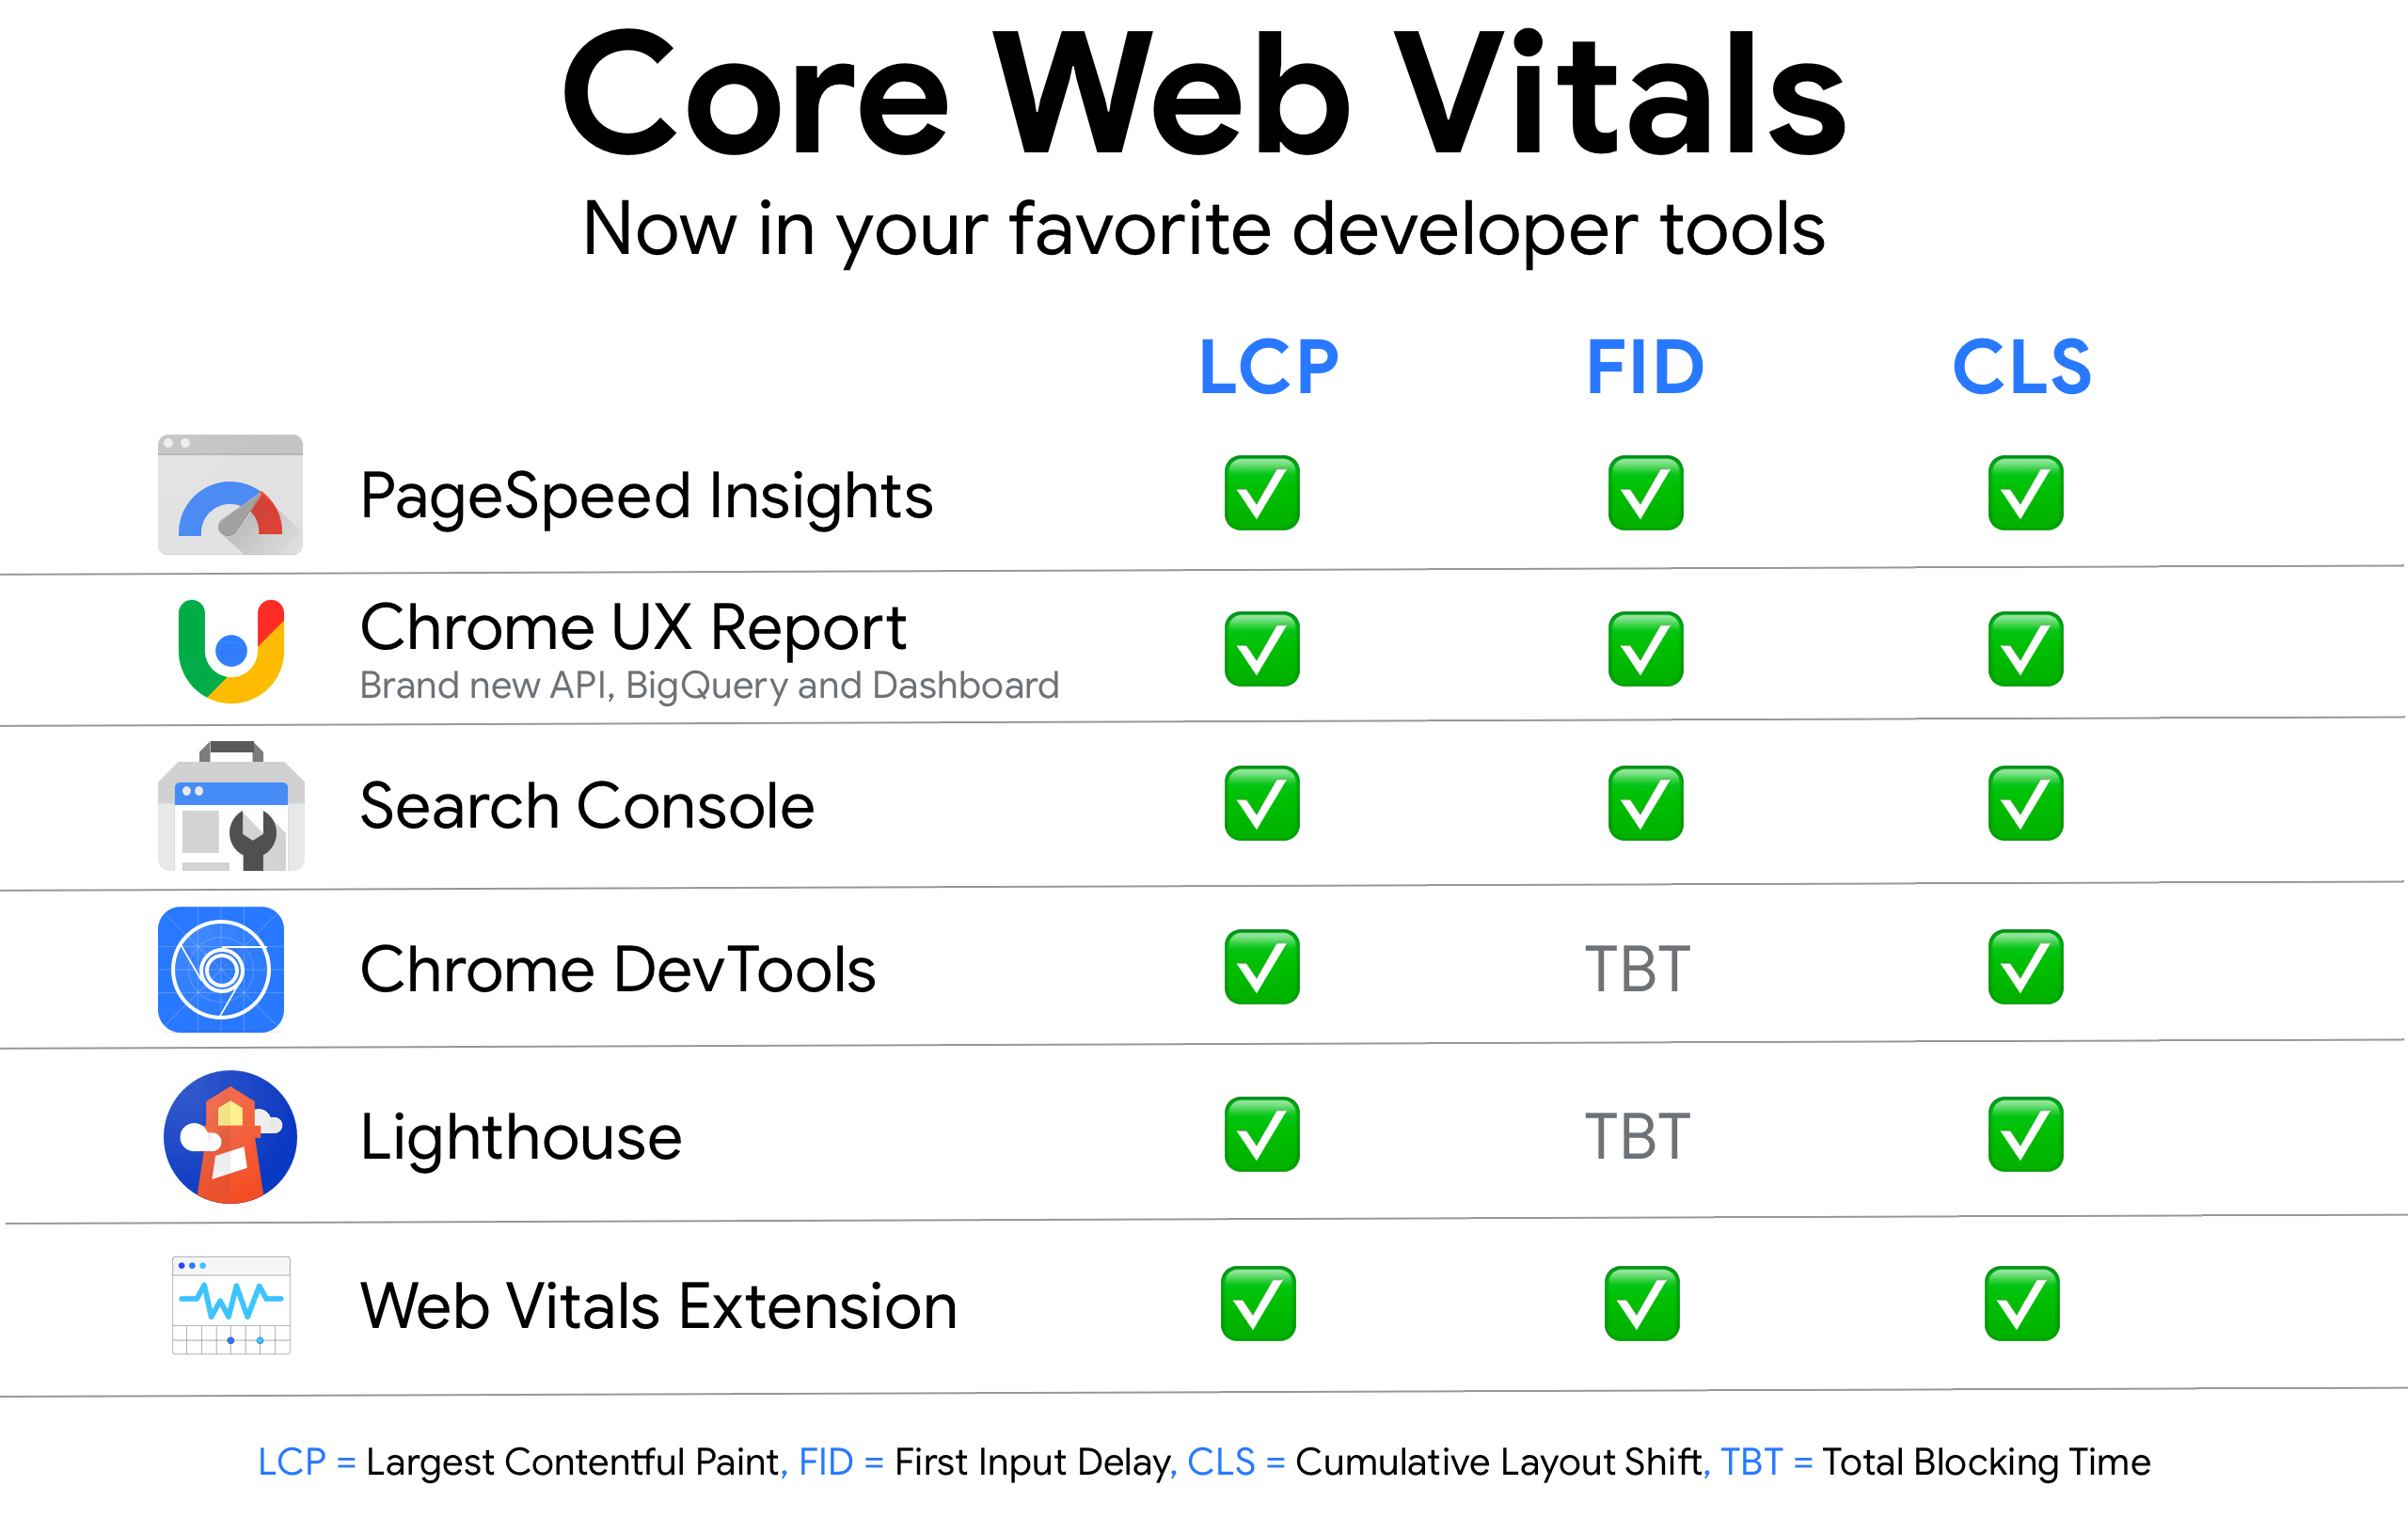
Key Term: Lab tools provide insight into how a potential user will likely experience your website and offer reproducible results for debugging. Field tools provide insight into how your real users are experiencing your website; this type of measurement is often called Real User Monitoring (RUM). Each lab or field tool offers distinct value for optimizing your user experience.
To begin your journey optimizing user-experience with Core Web Vitals, try the following workflow:
- Use Search Console's new Core Web Vitals report to identify groups of pages that require attention (based on the field data).
- Once you've identified pages that need work, use PageSpeed Insights (powered by Lighthouse and Chrome UX Report) to diagnose lab and field issues on a page. PageSpeed Insights (PSI) is available via Search Console or you can enter a URL on PSI directly.
- Ready to optimize your site locally in the lab? Use Lighthouse and Chrome DevTools to measure Core Web Vitals and get actionable guidance on exactly what to fix. The Web Vitals Chrome extension can give you a real-time view of metrics on desktop.
- Need a custom dashboard of Core Web Vitals? Use the updated CrUX Dashboard or new Chrome UX Report API for field data or PageSpeed Insights API for lab data.
- Looking for guidance? web.dev/measure can measure your page and show you a prioritized set of guides and codelabs for optimization, using PSI data.
- Finally, use Lighthouse CI on pull requests to ensure there are no regressions in Core Web Vitals before you deploy a change to production.
With that introduction, let's dive into the specific updates for each tool!
Lighthouse #
Lighthouse is an automated website auditing tool that helps developers diagnose issues and identify opportunities to improve the user experience of their sites. It measures several dimensions of user experience quality in a lab environment, including performance and accessibility. The latest version of Lighthouse (6.0, released mid-May 2020) includes additional audits, new metrics, and a newly composed performance score.
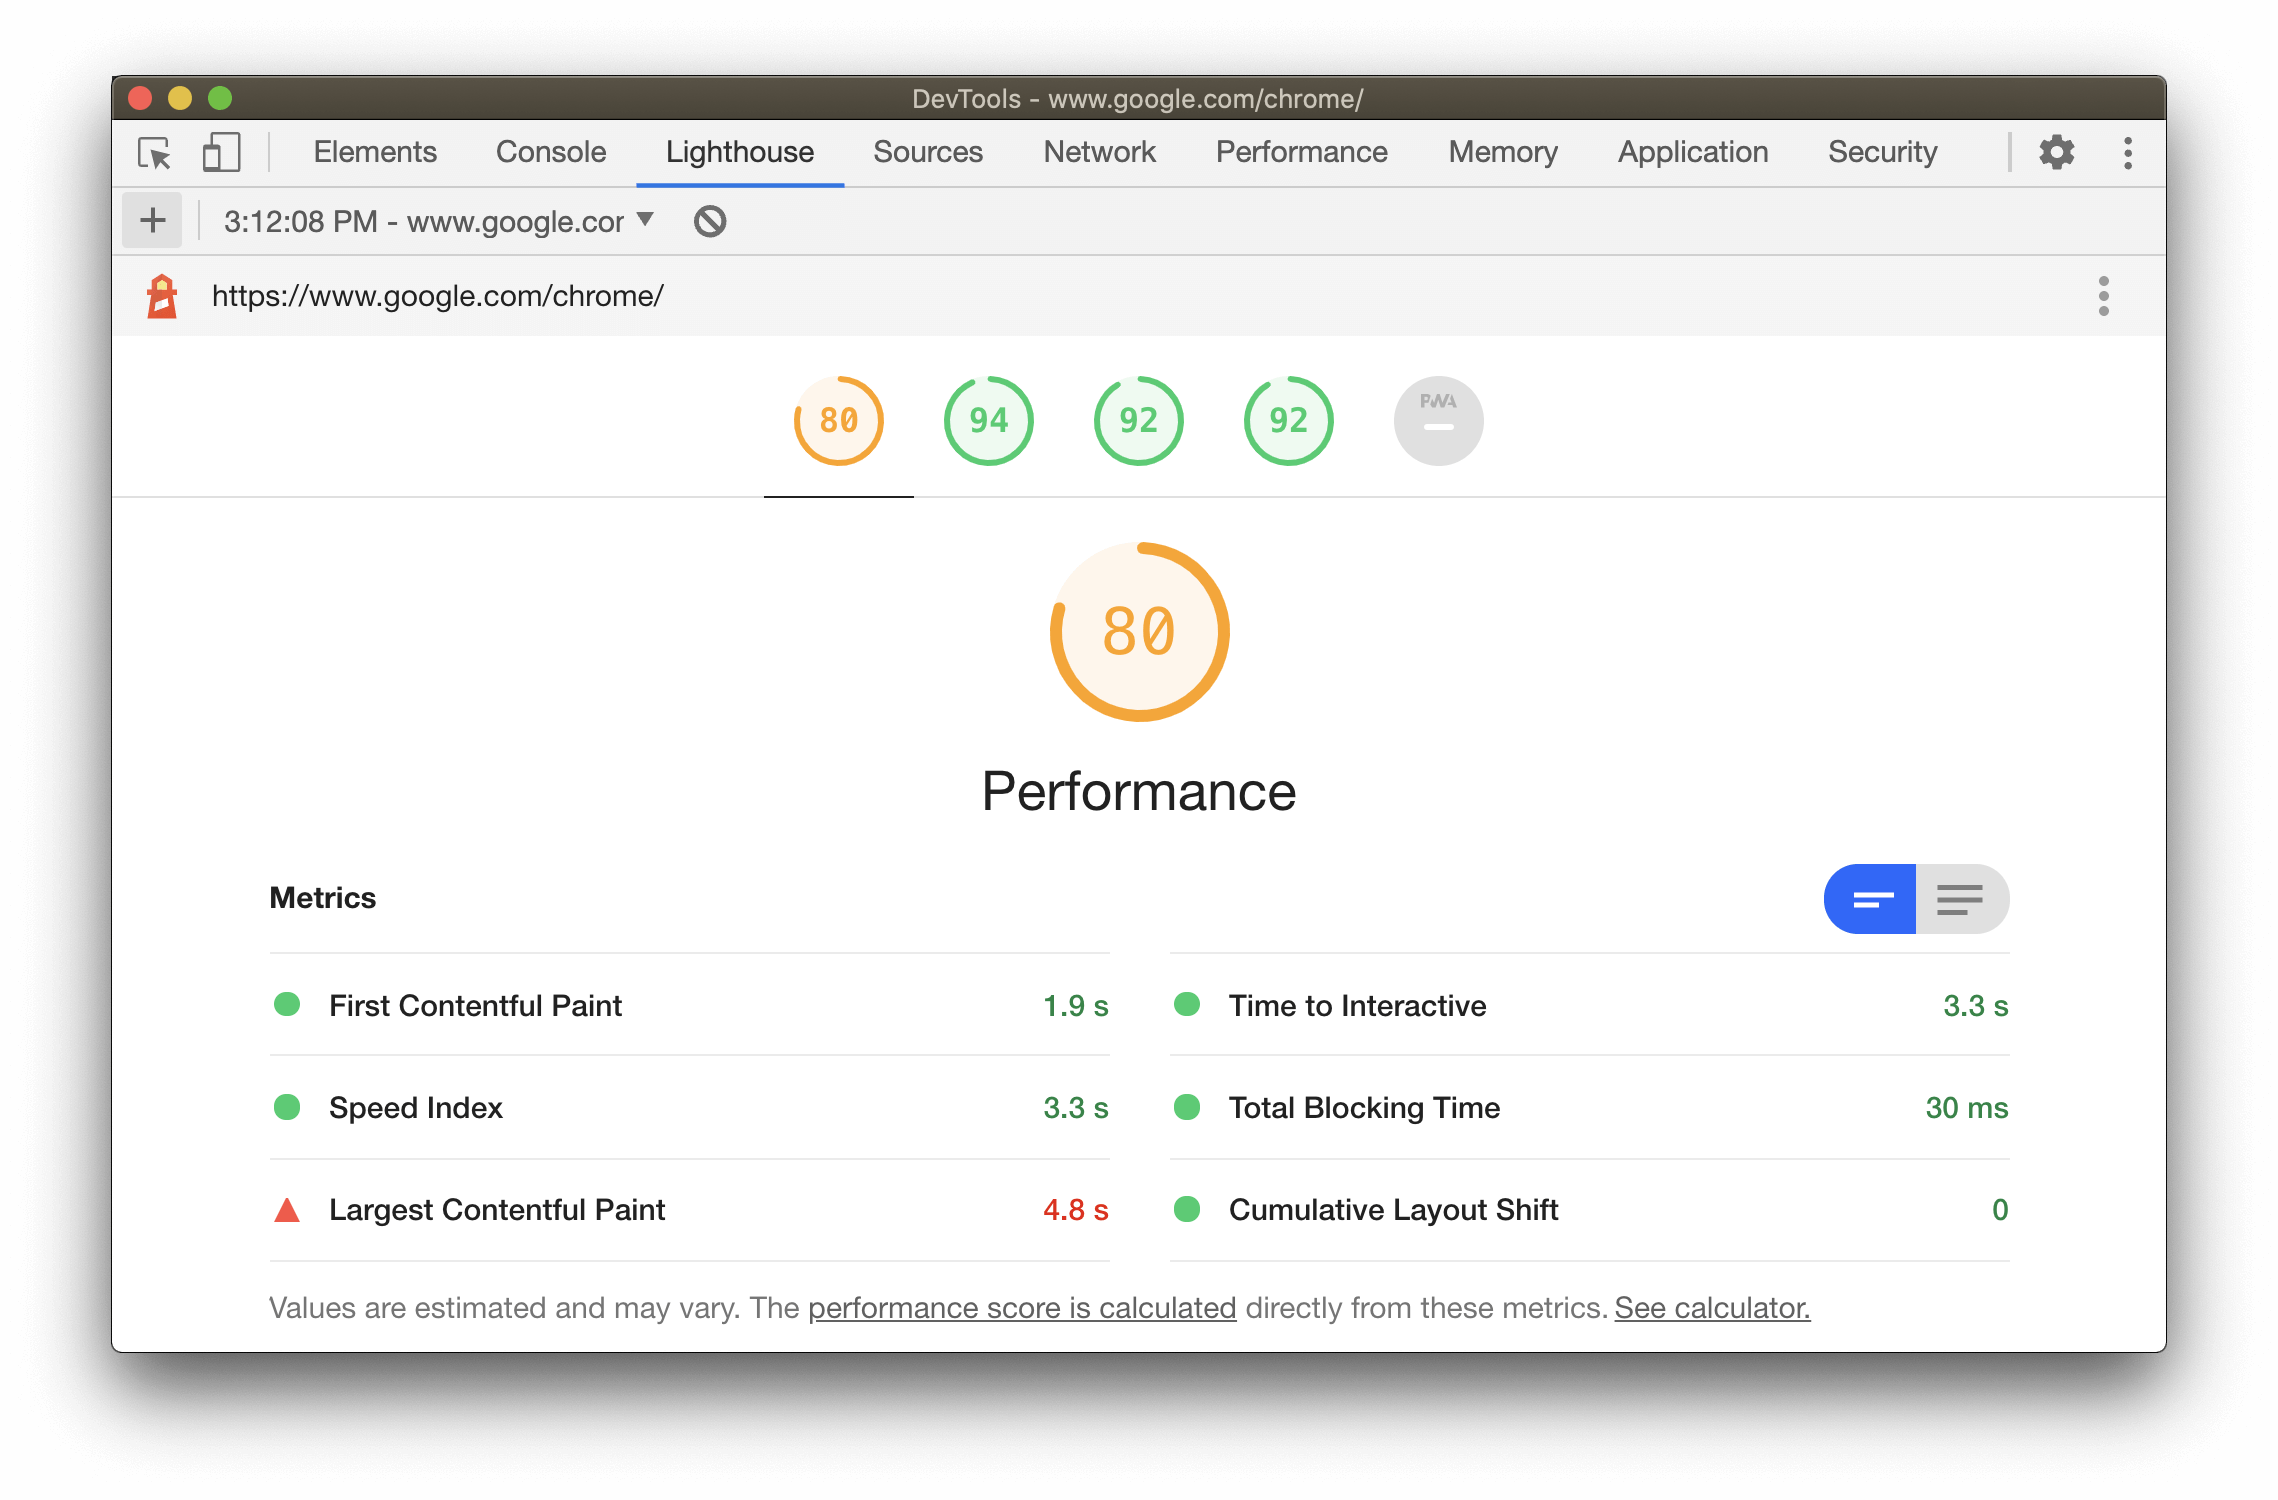
Lighthouse 6.0 introduces three new metrics to the report. Two of these new metrics—Largest Contentful Paint (LCP) and Cumulative Layout Shift (CLS)—are lab implementations of Core Web Vitals and provide important diagnostic information for optimizing user experience. Given their importance for assessing user experience, the new metrics are not only measured and included in the report, they are also factored in calculating the performance score.
The third new metric included in Lighthouse—Total Blocking Time (TBT)—correlates well with the field metric First Input Delay (FID), another Core Web Vitals metric. Following the recommendations provided in the Lighthouse report and optimizing against your scores sets you up to provide the best possible experience to your users.
All of the products that Lighthouse powers are updated to reflect the latest version, including Lighthouse CI which enables you to easily measure your Core Web Vitals on pull requests before they're merged and deployed.
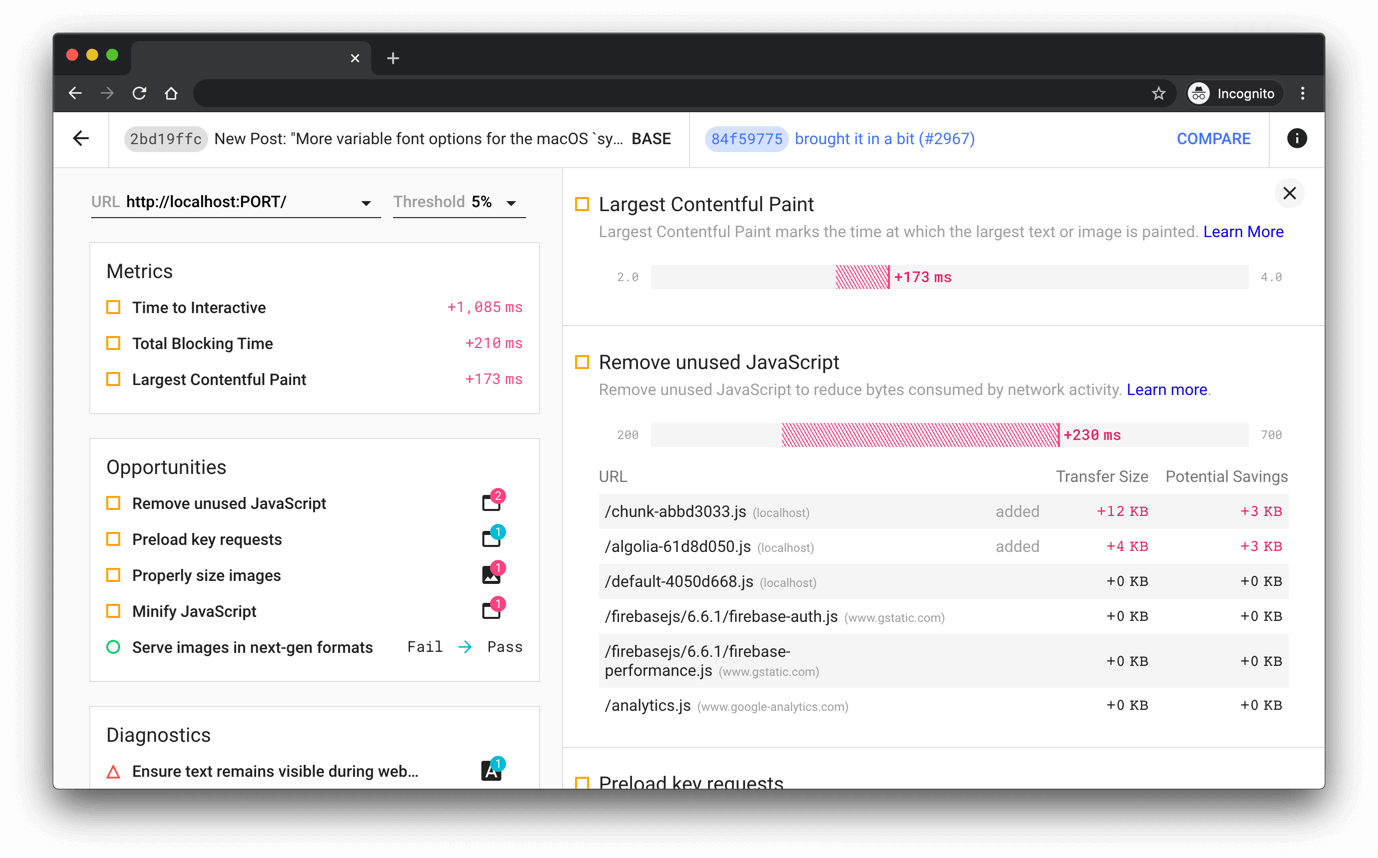
To learn more about the latest updates to Lighthouse, check out our What's New in Lighthouse 6.0 blog post.
PageSpeed Insights #
PageSpeed Insights (PSI) reports on the lab and field performance of a page on both mobile and desktop devices. The tool provides an overview of how real-world users experience the page (powered by the Chrome UX Report) and a set of actionable recommendations on how a site owner can improve page experience (provided by Lighthouse).
PageSpeed Insights and the PageSpeed Insights API have also been upgraded to use Lighthouse 6.0 under the hood and now support measuring Core Web Vitals in both the lab and field sections of the report! Core Web Vitals are annotated with a blue ribbon as shown below.
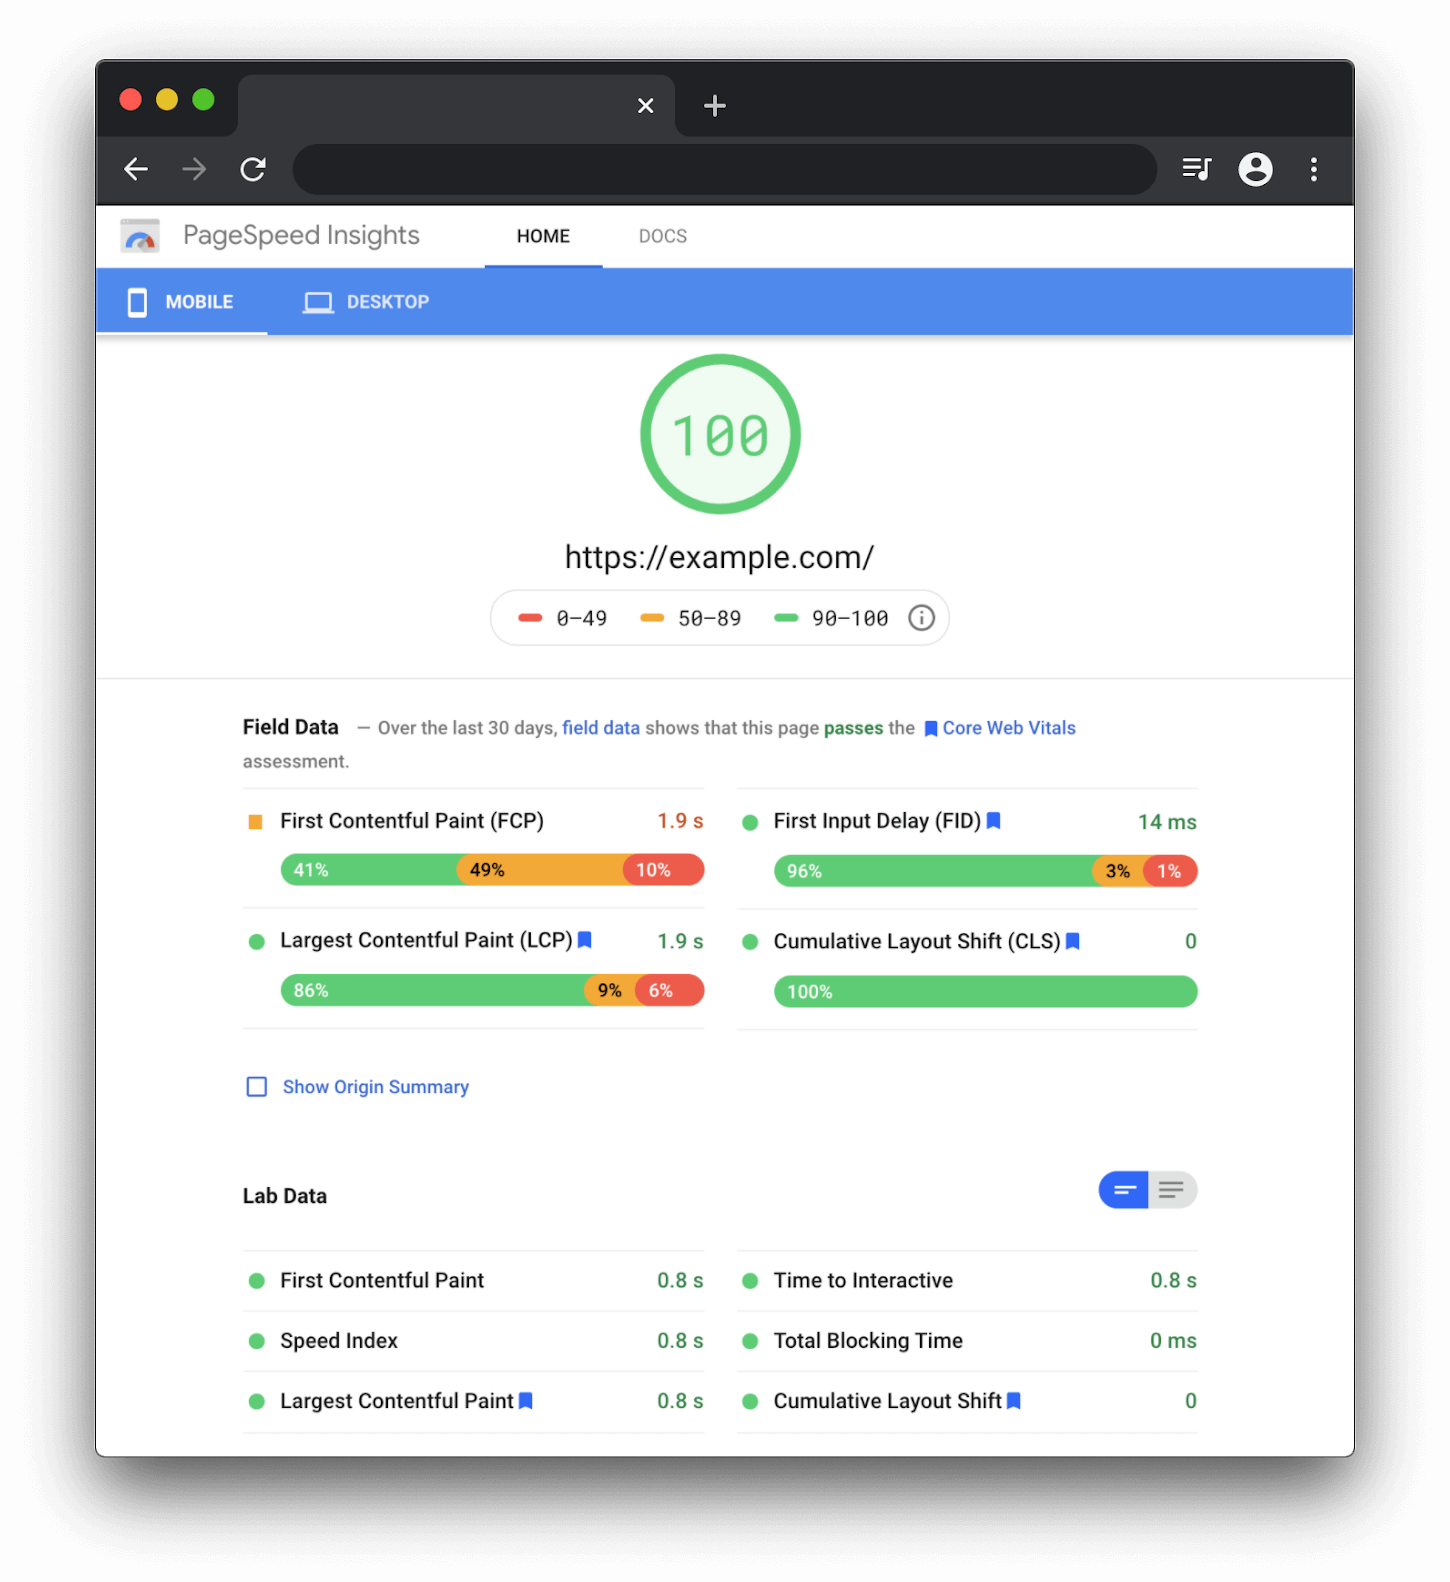
While Search Console provides site owners with a great overview of groups of pages that need attention, PSI helps identify per-page opportunities to improve page experience. In PSI, you are able to clearly see whether or not your page meets the thresholds for a good experience across all Core Web Vitals at the top of the report, indicated by passes the Core Web Vitals assessment or does not pass the Core Web Vitals assessment.
CrUX #
The Chrome UX Report (CrUX) is a public dataset of real user experience data on millions of websites. It measures field versions of all the Core Web Vitals. Unlike lab data, CrUX data comes from opted-in users in the field. Using this data, developers are able to understand the distribution of real-world user experiences on their own or even competitors' websites. Even if you don't have RUM on your site, CrUX can provide a quick and easy way to assess your Core Web Vitals. The CrUX dataset on BigQuery includes fine-grained performance data for all Core Web Vitals and is available in monthly snapshots at the origin-level.
The only way to truly know how your site performs for your users is to actually measure its performance in the field as those users are loading and interacting with it. This type of measurement is commonly referred to as Real User Monitoring—or RUM for short. Even if you don't have RUM on your site, CrUX can provide a quick and easy way to assess your Core Web Vitals.
Introducing the CrUX API
Today we're happy to announce the CrUX API, a fast and free way to easily integrate your development workflows with origin and URL-level quality measurement for the following field metrics:
- Largest Contentful Paint
- Cumulative Layout Shift
- First Input Delay
- First Contentful Paint
Developers can query for an origin or URL and segment results by different form factors. The API updates daily and summarizes the previous 28 days worth of data (unlike the BigQuery dataset, which is aggregated monthly). The API also has the same relaxed public API quotas we place on our other API, the PageSpeed Insights API (25,000 requests per day).
Below is a demo using the CrUX API to visualize the Core Web Vitals metrics with distributions for good, needs improvement, and poor:

In future releases, we plan to expand the API to enable access to additional CrUX dataset dimensions and metrics.
Revamped CrUX Dashboard
The newly redesigned CrUX Dashboard allows you to easily track an origin's performance over time, and now you can use it to monitor the distributions of all of the Core Web Vitals metrics. To get started with the dashboard, check out our tutorial on web.dev.

We've introduced a new Core Web Vitals landing page to make it even easier to see how your site is performing at a glance. We welcome your feedback on all CrUX tooling; to share your thoughts and questions reach us at the @ChromeUXReport Twitter account or Google Group.
Chrome DevTools Performance panel #
Debug Layout Shift events in the Experience section
The Chrome DevTools Performance panel has a new Experience section that can help you detect unexpected layout shifts. This is helpful for finding and fixing visual instability issues on your page that contribute to Cumulative Layout Shift.

Select a Layout Shift to view its details in the Summary tab. To visualize where the shift itself occurred, hover over the Moved from and Moved to fields.
Debug interaction readiness with Total Blocking Time in the footer
The Total Blocking Time (TBT) metric can be measured in lab tools and is an excellent proxy for First Input Delay. TBT measures the total amount of time between First Contentful Paint (FCP) and Time to Interactive (TTI) where the main thread was blocked for long enough to prevent input responsiveness. Performance optimizations that improve TBT in the lab should improve FID in the field.
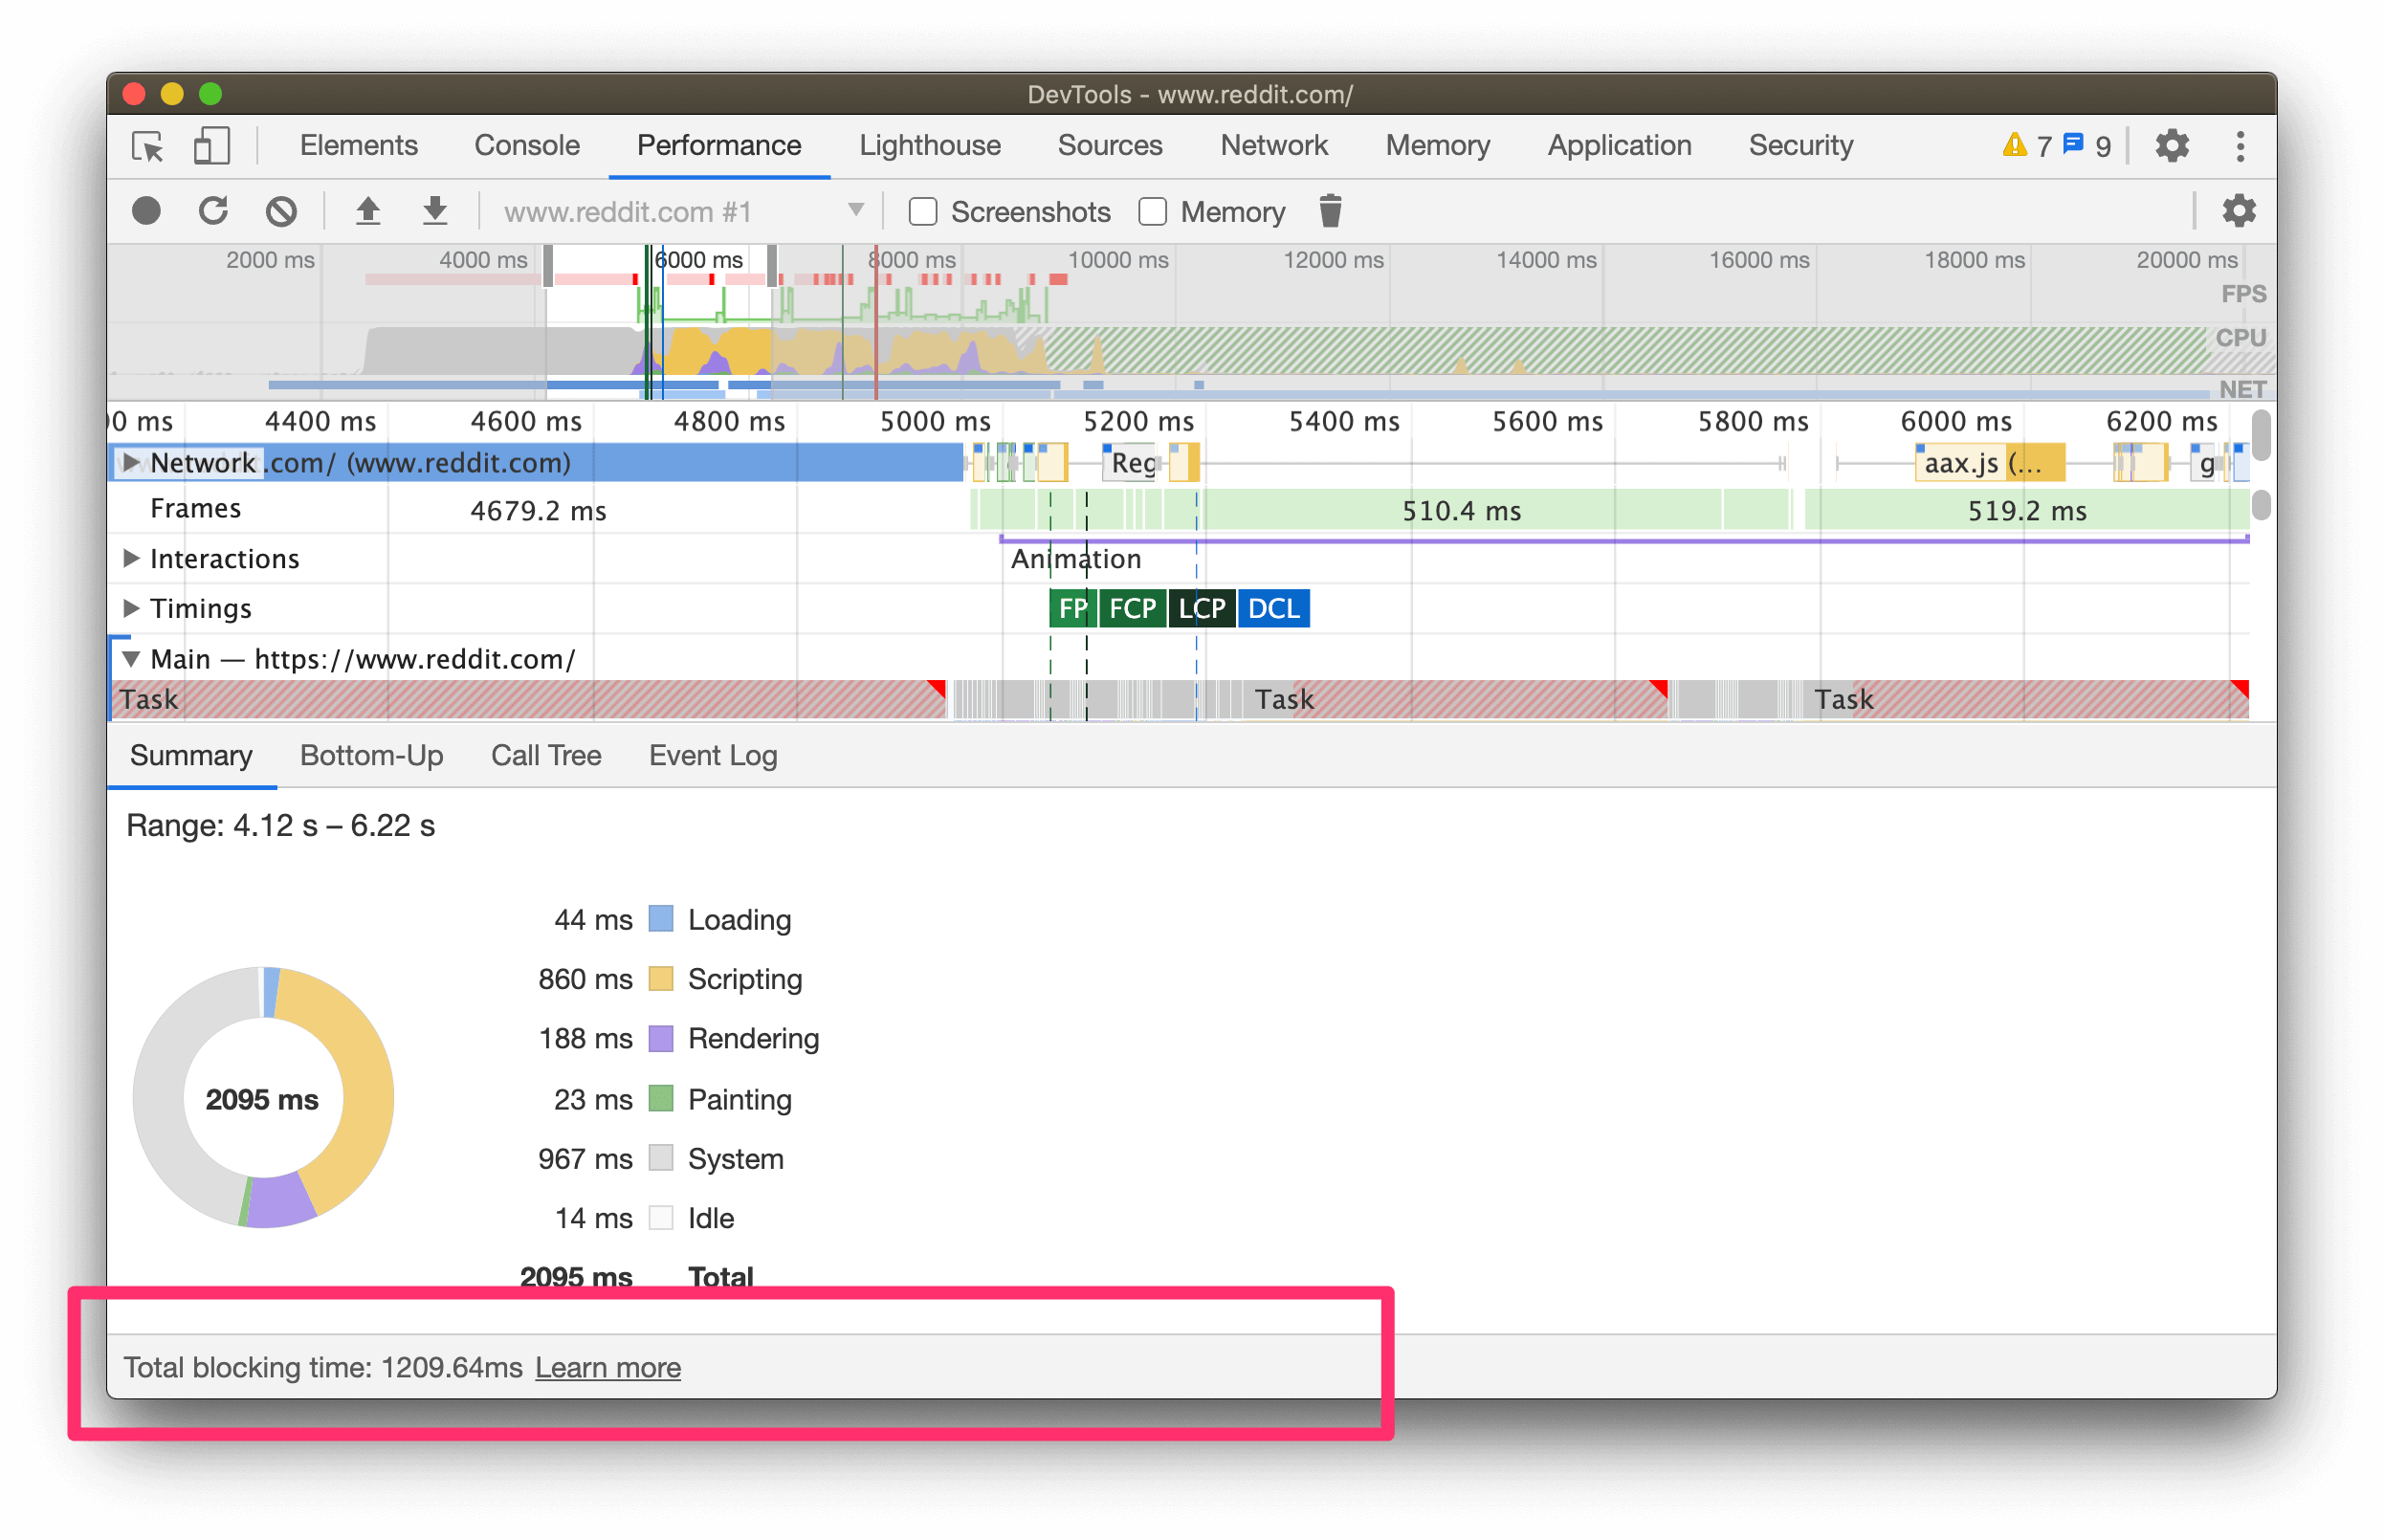
TBT is now shown in the footer of the Chrome DevTools Performance panel when you measure page performance:
- Press
Control+Shift+J(orCommand+Option+Jon Mac) to open DevTools. - Click the Performance tab.
- Click Record.
- Manually reload the page.
- Wait for the page to load and then stop recording.
For more information, see What's New In DevTools (Chrome 84).
Search Console #
The new Core Web Vitals report in Search Console helps you identify groups of pages across your site that require attention, based on real-world (field) data from CrUX. URL performance is grouped by status, metric type and URL group (groups of similar web pages).
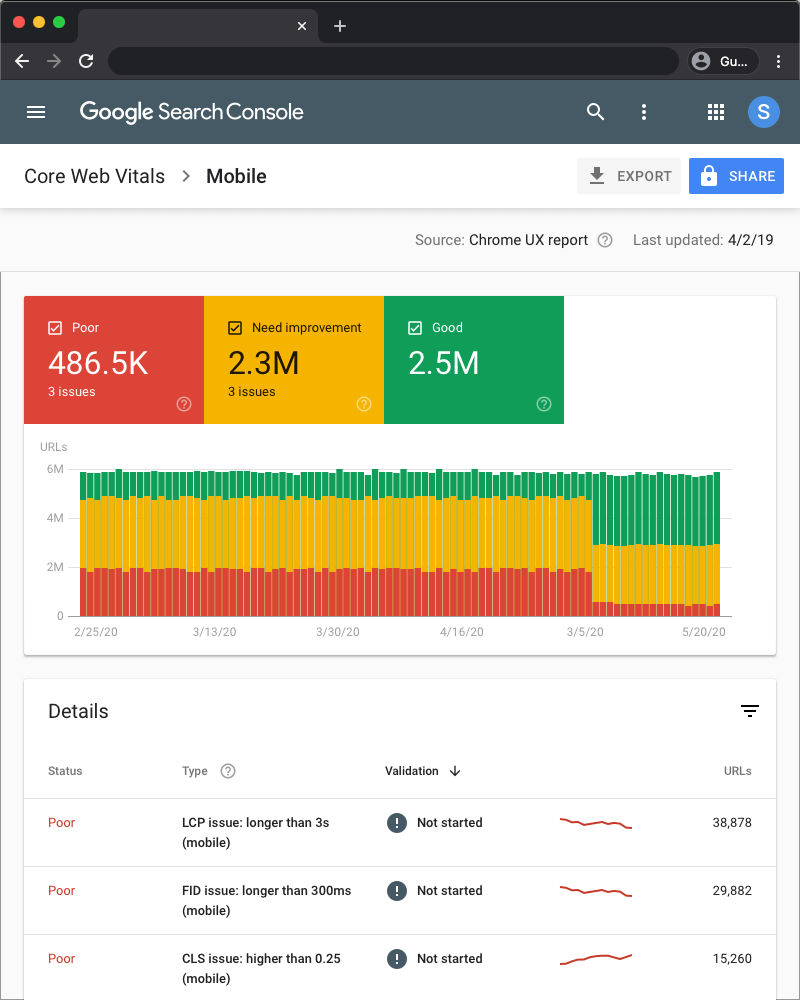
The report is based on the three Core Web Vitals metrics: LCP, FID, and CLS. If a URL does not have a minimum amount of reporting data for these metrics, it's omitted from the report. Try the new report to get a holistic view of performance for your origin.
Once you identify a type of page that has Core Web Vitals related issues, you can use PageSpeed Insights to learn about specific optimization suggestions for representative pages.
web.dev #
web.dev/measure allows you to measure the performance of your page over time, providing a prioritized list of guides and codelabs on how to improve. It's measurement is powered by PageSpeed Insights. The measure tool now also supports the Core Web Vitals metrics, as shown below:

Web Vitals extension #
The Web Vitals extension measures the three Core Web Vitals metrics in real-time for (desktop) Google Chrome. This is helpful for catching issues early on during your development workflow and as a diagnostic tool to assess performance of Core Web Vitals as you browse the web.
The extension is now available to install from the Chrome Web Store! We hope you find it useful. We welcome any contributions to improve it as well as feedback on the project's GitHub repository.

Quick highlights #
That's a wrap! What can you do next:
- Use Lighthouse in DevTools to optimize your user experience and ensure you are setting yourself up for success with Core Web Vitals in the field.
- Use PageSpeed Insights to compare your lab and field Core Web Vitals performance.
- Try out the new Chrome User Experience Report API to easily access how well your origin and URL have performed against Core Web Vitals over the last 28 days.
- Use the Experience section and footer in DevTools Performance panel to dive deep and debug against specific Core Web Vitals.
- Use Search Console's Core Web Vitals report for a summary of how your origins are performing in the field.
- Use the Web Vitals Extension to track a page's performance against Core Web Vitals in real-time.
- We will cover more about our Core Web Vitals tooling at web.dev Live in June. Sign up to get updates on the event!
- by Elizabeth and Addy, WebPerf Janitors


