All the bits and pieces.

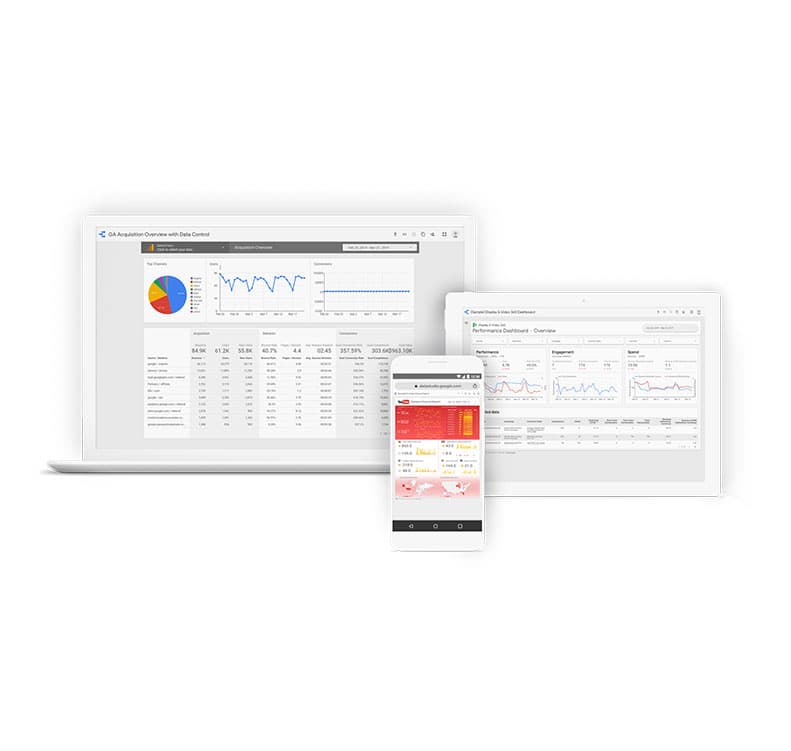
Whether you’re looking to create detailed reports or high-level dashboards, Data Studio has the tools you need to easily bring your data analysis together, create compelling visualizations, and share insights with your team.

All the bits and pieces.

Data Connectors

Data sources act as pipes to connect a Data Studio report to a collection of underlying data. Each source has a unique, pre-built connector to ensure your data is easy to access and use.

  • Community Connectors

    Explore the community-developed connectors that enable access to a variety of information sources. Learn more.
  • Campaign Manager 360

    Create a real-time dashboard to monitor and measure the success of your campaigns, optimize your advertising efforts, and make smarter marketing decisions. Learn more.
  • Google Ads

    Create a real-time Google Ads dashboard to optimize your advertising efforts and to help you make smarter marketing decisions. Learn more.
  • Analytics

    Easily build a Google Analytics dashboard to monitor the performance of your website, mobile app, or internet-connected device. Learn more.
  • Google BigQuery

    Build a custom BigQuery dashboard within Data Studio to monitor data from your big data warehouse or to visualize your key business metrics in real time. Learn more.
  • Google Cloud SQL

    Make Cloud SQL data understandable and shareable with a broader audience through a secure connection using standard JDBC and SSH Tunneling, without having to worry about SQL queries. Learn more.
  • Google Sheets

    With Data Studio, you can build a custom Google Sheets dashboard to manage your spreadsheet and CSV data. Learn more.
  • MySQL

    Create a custom MySQL dashboard to keep track of your most important database metrics and use a real-time dashboard to get the most from your data. Learn more.
  • PostgreSQL

    Leverage data housed in the PostgreSQL open source relational database management system within Data Studio. This connector uses the PostgreSQL JDBC driver to connect a Data Studio data source to a single PostgreSQL database table. Learn more.
  • YouTube

    Easily create visualizations from any field available in the YouTube API to create a fully automated YouTube dashboard for your channel. Learn more.
  • Dynamic, Secure Data Connections

    Connect and access years of data for each of your accounts and data sources. Secure APIs provide data that is dynamically updated each time the report is accessed or refreshed.

Data Transformation

Once you have your raw data, it often needs to be transformed into more complete and meaningful information. Data Studio turns your data’s dimensions and metrics into powerful building blocks for charts and graphs.

  • Explorer

    Get insights from your data quickly, without needing to know or write SQL queries. Data Studio now has a dedicated space for fast, ad-hoc querying where you can explore a data table visually with just one click.
  • Calculated Metrics

    Use powerful solutions to create new metrics or dimensions based on custom formulas. Formulas can include fields from the data source, literal text, and numeric values. You can also apply arithmetic, logical, comparison, unary and binary operators, as well as more sophisticated functions.
  • Functions

    Data Studio provides dozens of mathematical, string, date, and other functions to transform your data into more useful values. You can use these functions individually or combine them with other functions and operators to create sophisticated calculated fields.

Data Visualization

Whether you’re tweaking an existing report or starting from scratch, Data Studio offers visualization and customization solutions that help you engage and persuade with an engaging data story.

  • Customizations

    Data Studio allows you to customize every aspect of your reports and dashboards. Add logos and icons; change the background, fill, line, and text colors; and choose from an array of fonts, line styles, and object properties to make your data come to life. And once you have a style that works, it’s easy to make it a reusable, sharable template.
  • Data Control

    Easily and quickly give viewers a way to select the data they want to see in a report from multiple sources — including Analytics, Google Ads, Search Console, YouTube, and Campaign Manager 360 — eliminating the need to create a separate reports for various account views.
  • Dynamic Controls

    Insert dynamic controls to allow viewers to dynamically change the data presented, including date ranges and dimension filters like geography, segment, or channel.
  • Shapes and Images

    Easily add shapes, images, and text to your reports and dashboards to make them easier to read and highlight important aspects of the data.
  • Visualizations

    Choose from a broad array of charts, graphs, pivot tables and visualizations to bring your data to life. These include time series, bar charts, pie charts, tables, heat maps, geo maps, scorecards, scatter charts, bullet charts, and area charts. Each visualization has built-in comparison functions, making it easy to see changes in the data period over period.

Sharing and Collaboration

Democratize your data and tap into the collective wisdom of your team by sharing and collaborating on all your Data Studio reports and dashboards.

  • Built-in Sharing

    Data Studio is built with the same technology as Google Drive, which means you get to decide who gets access to your reports. Manage access by granting individuals or groups, inside and outside your company, the right to edit or view with just a few clicks.
  • Real-Time Collaboration

    Work on a single report with teammates or people outside your company. Invite them to edit and collaborate on your dashboards and reports in real time. See edits as they happen and have all changes automatically saved.

Usability

Data Studio was designed with a casual user in mind, but with so many easy-to-use features, seasoned analytics teams are sure to love it, too.

  • Easy-to-Use Web Interface

    Whether you’re new to data and reporting solutions or an old pro, you’ll find that Google has designed Data Studio to be intuitive and easy to use. The report editor features simple drag-and-drop objects with full custom property panels and a snap-to-grid canvas.
  • Report Templates

    With a library of report templates to choose from, you can be up and running in minutes. Simply connect your data sources and customize the design and style to match your needs.
  • User Administration

    You decide who gets access to Data Studio. Leveraging Google Drive technology, you can easily manage all of your users and their level of access — grant individuals or groups the right to create, edit, or view.