

GitHub Insights
Development metrics that matter
Set goals and ship faster, together. From developer to CEO, GitHub Insights uses the knowledge of the world’s largest developer community to keep everyone in your organization moving forward.
Contact SalesCurrently available for teams using GitHub One.
A clear picture of the development lifecycle
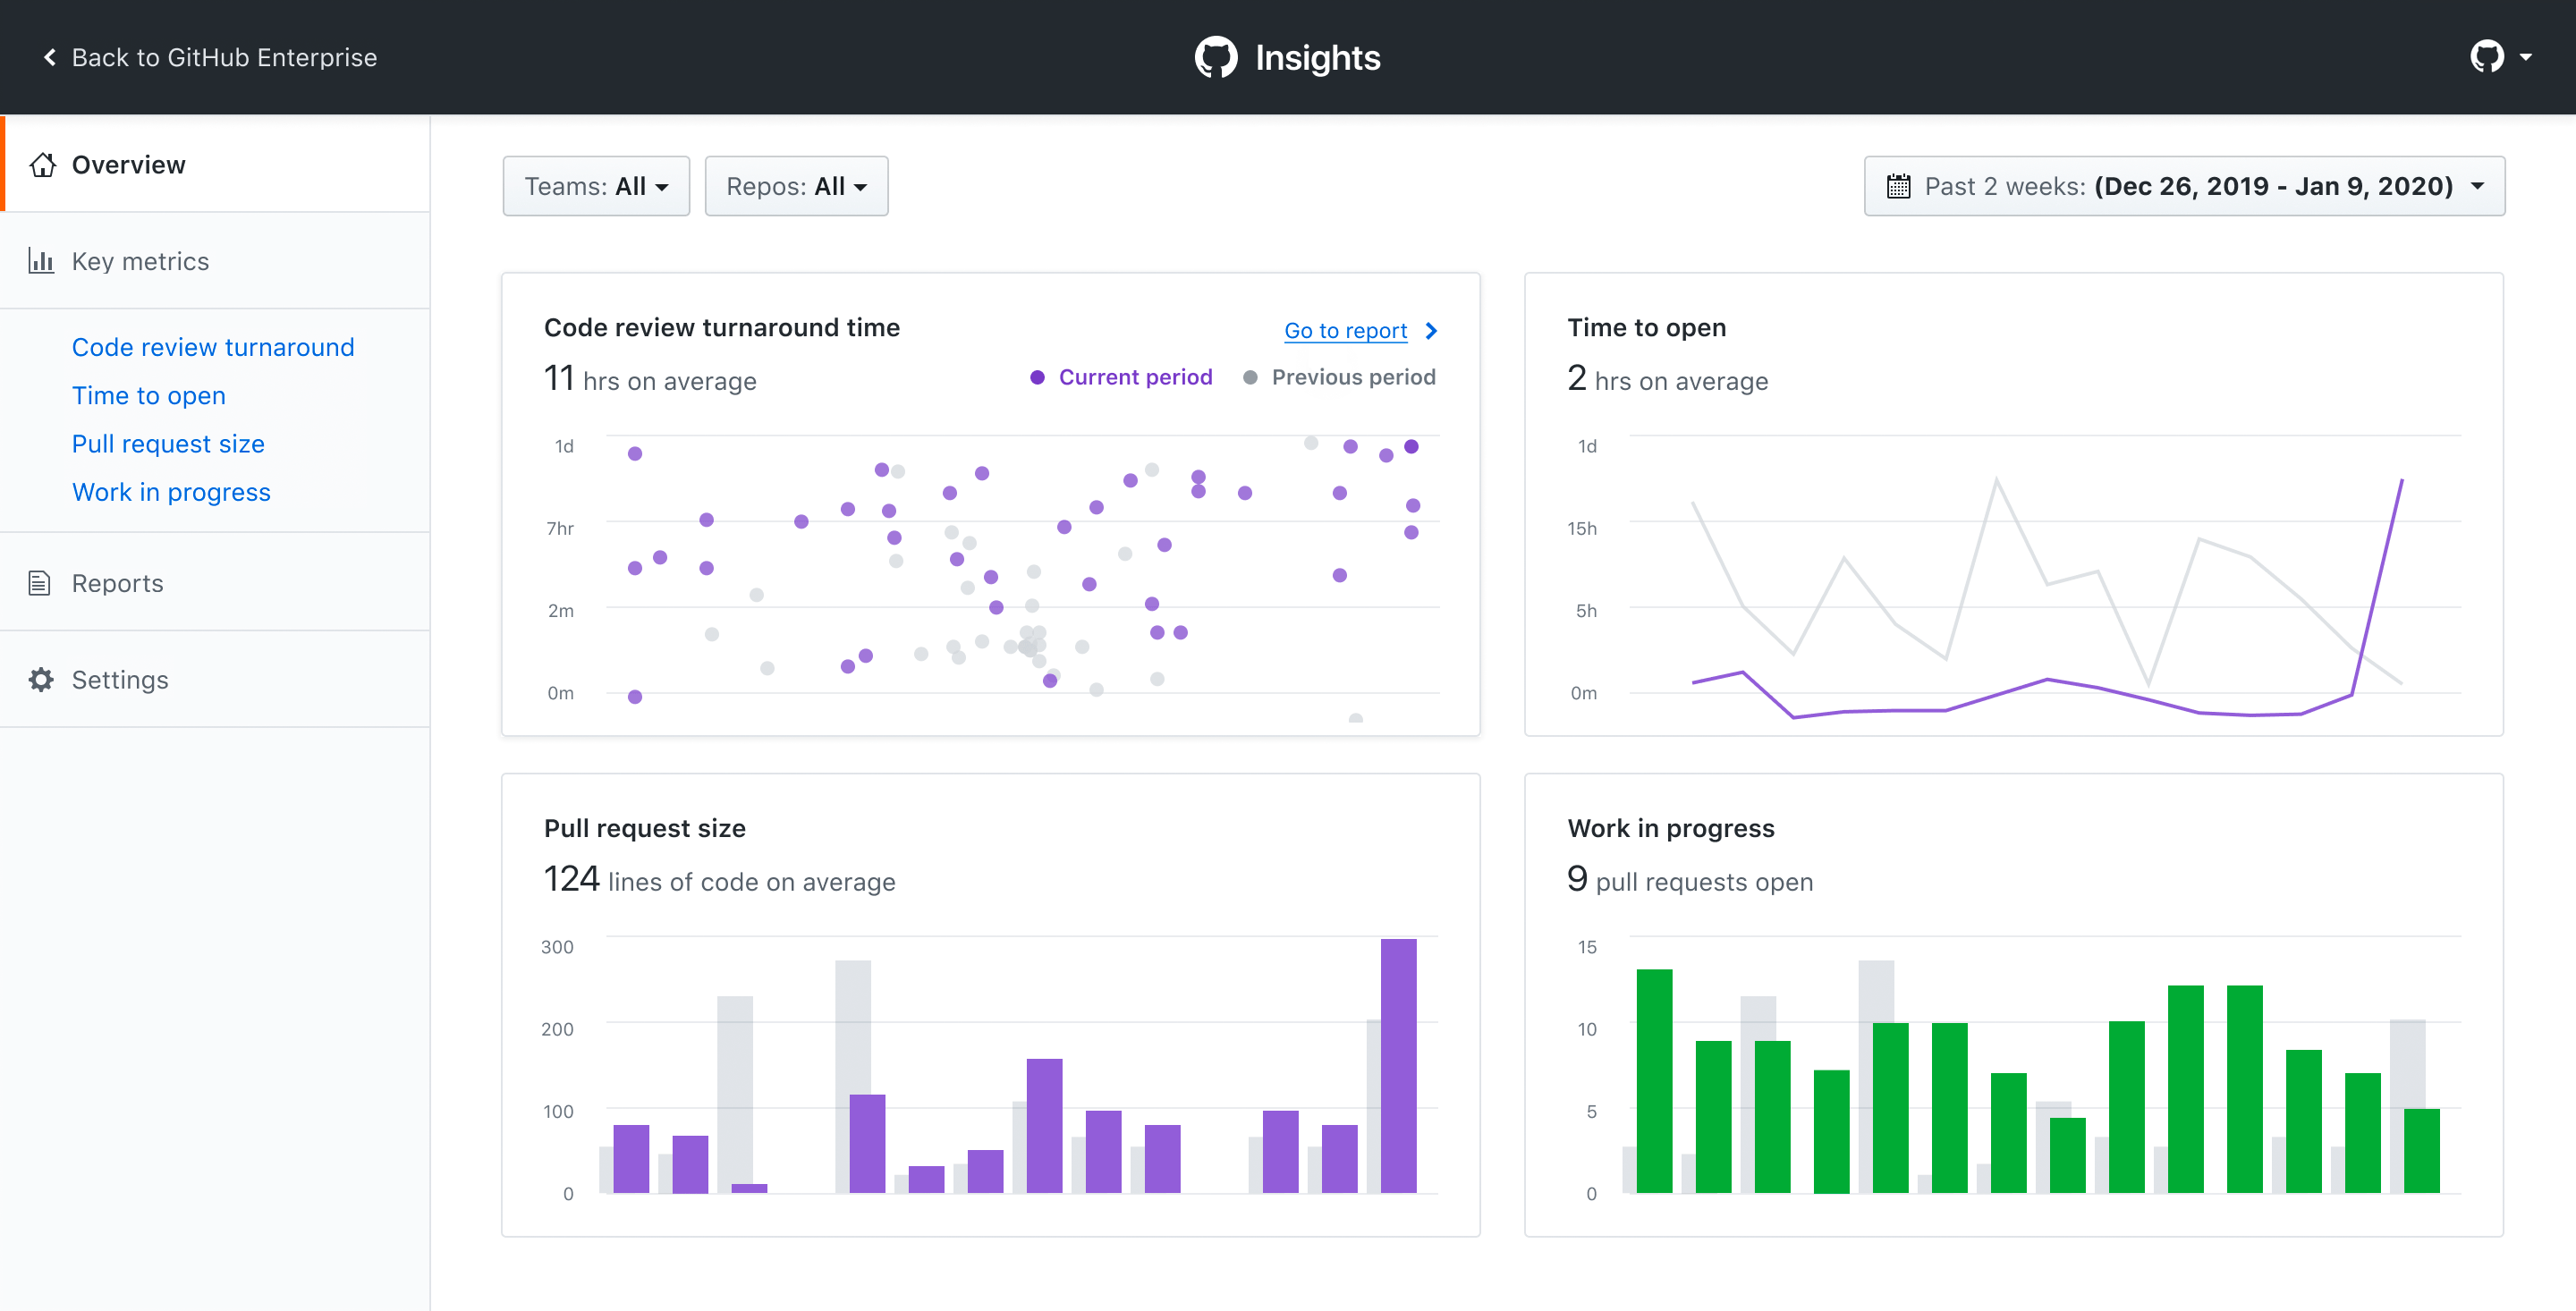
Every step counts. GitHub Insights shows your team how to work better with each pull request, review, and commit.

Focus on key details with filters by team, repository, and date
Pinpoint blockers with rich data about pull requests, team activity, and your code base
Track progress towards your goals using key metrics chosen by leading software teams
Actionable measurement,
at your fingertips
With real-time feedback, you can narrow in on the process changes that help you ship your best software.

Align your entire organization
Get a transparent view into your development cycle and empower everyone on your team to check status, improve processes, and collaborate more closely.

Ship faster through better process
Measure every step of your development process so teams can make decisions that shorten cycles and speed time to market.

Get research-backed guidance
Make sure what you’re measuring is making a difference with actionable, helpful, and impactful KPIs validated by the GitHub community.

See progress in real time
Visualize current activity, get up-to-date snapshots, and understand how your team collaborates as quickly as the work happens.
Metrics that unite
Software is a team effort. GitHub Insights helps everyone see how your organization works together.
Developers
See how you contribute and find new ways to learn, improve, and grow with your team.
- Guide collaboration based on objective data
- Visualize team interactions to improve together
Managers
Identify blockers and improve processes to keep the whole team moving and growing.
- Add event markers to track process improvements
- Act quickly with real-time updates and snapshots
Executives
Get the data you need to align and engage teams across your organization.
- View organization-level reports filtered by team, project, and date
- Benchmark, set, and track targets for teams