
Tweets
- Tweets, current page.
- Tweets & replies
- Media
You blocked @ChromeDevTools
Are you sure you want to view these Tweets? Viewing Tweets won't unblock @ChromeDevTools
-
Pinned Tweet
This month's
#AskChrome is all about DevTools! Ask us anything about@ChromeDevTools and we'll answer your questions in a livestream later this month.https://youtu.be/3NLX632F2k8Thanks. Twitter will use this to make your timeline better. UndoUndo -
DevTools now shows how
@v8js saves time through streaming compilation, by taking advantage of the wait time for loading JS. Also see https://v8.dev/blog/background-compilation …pic.twitter.com/G2RnBQfvJP Thanks. Twitter will use this to make your timeline better. UndoUndo
 -
Bear in mind that this should "just work" with native compilers, but on the tooling side DWARF support is still in progress. For example, Emscripten (Binaryen) and wasm-bindgen don't support updating DWARF after transformations, so they won't benefit from this integration yet.
Show this threadThanks. Twitter will use this to make your timeline better. UndoUndo -
Initial DWARF support has landed in Chrome DevTools! It means that you can resolve stack traces, set breakpoints and step-in/-over source code in C/C++/Rust natively, without generating source maps.pic.twitter.com/s3IwkJV6Tr
 Show this threadThanks. Twitter will use this to make your timeline better. UndoUndo
 -
What looks like a small change involved a lot of thoughts. We explored design options (https://bit.ly/2JWWZ1l ), and worked with the
@v8js team to implement (https://bit.ly/2NrQp4U ).https://twitter.com/ChromeDevTools/status/1192426360674885632 … Thanks. Twitter will use this to make your timeline better. UndoUndo
 -
Rerunning code that declare let-variables no longer cause failures in DevTools console. We hope this makes trying out code more convenient!pic.twitter.com/qNagdQlb5v
Thanks. Twitter will use this to make your timeline better. UndoUndo -
Last call for
#AskChrome questions! We'll be happy to answer anything about DevTools, like "what's the best way to do X", feature requests... you name it. Reply to this tweet with your questions, or comment in this thread: https://www.reddit.com/r/webdev/comments/dfix1j/ …https://twitter.com/ChromeDevTools/status/1181956121457651712 …Thanks. Twitter will use this to make your timeline better. UndoUndo -
Just reply to this tweet with your questions for
#AskChrome. We've also got a thread started on r/webdev: https://www.reddit.com/r/webdev/comments/dfix1j …https://twitter.com/ChromeDevTools/status/1181956121457651712 …Thanks. Twitter will use this to make your timeline better. UndoUndo -
Thanks. Twitter will use this to make your timeline better. UndoUndo
-
Congratulations
@FirefoxDevTools. Great feature.https://twitter.com/FirefoxDevTools/status/1171849566817148928 …
 Now in Beta: Inactive CSS!
We show you which CSS properties aren’t affecting the selected element and why.
(Has this saved you time already? We love hearing from you and seeing screenshots!)
—
Now in Beta: Inactive CSS!
We show you which CSS properties aren’t affecting the selected element and why.
(Has this saved you time already? We love hearing from you and seeing screenshots!)
—@violasong https://www.mozilla.org/en-US/firefox/channel/desktop/ … pic.twitter.com/zoKxyfxH24Thanks. Twitter will use this to make your timeline better. UndoUndo -
On top of opening the Elements panel, this shortcut also enables Inspect Mode. As you hover over elements you'll see a detailed tooltip with commonly needed info about the element, like color, font, contrast ratio https://developers.google.com/web/updates/2019/01/devtools#inspect … ^
@kaycebasques https://twitter.com/randomshortcuts/status/1171347754809012224 …pic.twitter.com/TOl0LSOrBg Thanks. Twitter will use this to make your timeline better. UndoUndo
 -
Chrome DevTools Retweeted
 DevTools Tip: Use console.groupCollapsed() to have have your messages collapsed by default.
Use .group() to expand by default.
Helps avoid a cluttered console!pic.twitter.com/vf0Rml6eeC
DevTools Tip: Use console.groupCollapsed() to have have your messages collapsed by default.
Use .group() to expand by default.
Helps avoid a cluttered console!pic.twitter.com/vf0Rml6eeC Thanks. Twitter will use this to make your timeline better. UndoUndo
 -
Chrome DevTools Retweeted
Puppeteer Recorder is game-changing for tests: https://bit.ly/pptr-recorder ~ This Chrome extension records interactions & *generates* replay scripts
 pic.twitter.com/HX4W513AsEThanks. Twitter will use this to make your timeline better. UndoUndo
 -
Chrome DevTools Retweeted
Quickly determine JavaScript performance bottlenecks of interactions in your app via the Performance tab of
@ChromeDevTools. There's a LOT more to this stuff, but learning how to use these tools is super helpful!pic.twitter.com/UbTR6ZUUNTThanks. Twitter will use this to make your timeline better. UndoUndo -
Chrome DevTools Retweeted
One of my favorite
@ChromeDevTools tricks is when you can't figure out what CSS selector is causing what you see, click on the Computed tab in the Elements panel. It shows who wins after the specificity wars :) And you can click on a property to take you to the specific rule!pic.twitter.com/TcBKhiJYjI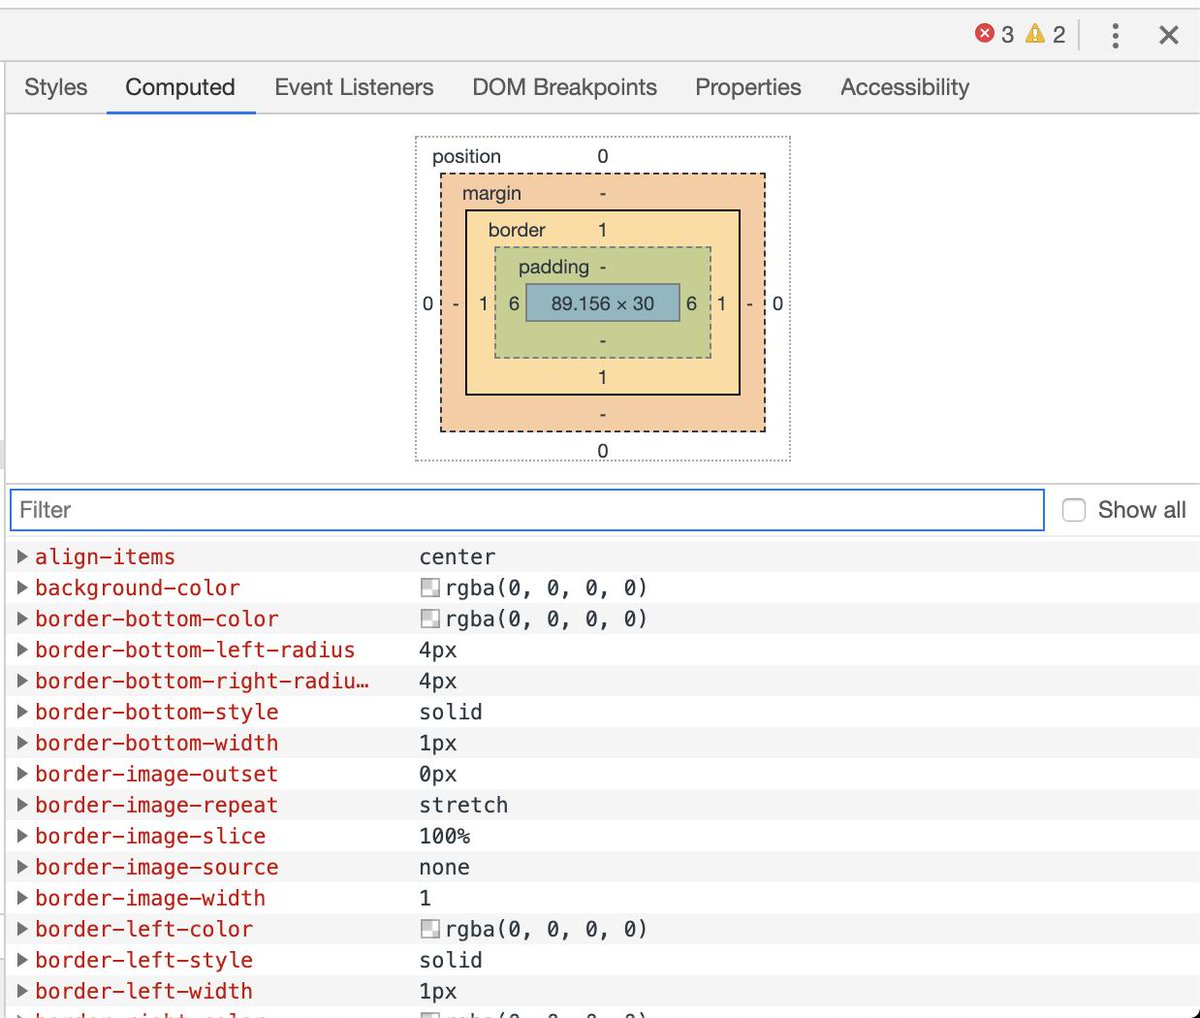 Thanks. Twitter will use this to make your timeline better. UndoUndo
 -
Settings > Preferences > Elements > Show User Agent Shadow DOMhttps://twitter.com/Vazerthon/status/1164180585503428609 …
 Thanks. Twitter will use this to make your timeline better. UndoUndo
 -
Chrome DevTools Retweeted
You can view your console log in an ordered fashion with a nice feature of
@ChromeDevTools. Just expand your console and you will see per file logs, warnings, infos etc. Very useful on larger projects
#freeCodeCamp#100DaysOfCodepic.twitter.com/F4drxqzEeb Thanks. Twitter will use this to make your timeline better. UndoUndo
 -
Chrome DevTools RetweetedTIL: From chrome v77 we can copy individual HTML element styles via context menu in devTools

@ChromeDevTools For more see what's new in Chrome v77 - https://youtube.com/watch?v=R8KzoMoKhnM …pic.twitter.com/wH8qEJalWf Thanks. Twitter will use this to make your timeline better. UndoUndo
 -
Chrome DevTools Retweeted
A keyboard shortcut for Chrome DevTools (
@ChromeDevTools) Shortcut: command + option + f Command: Opens the Search tab in the Drawer See more Chrome DevTools shortcuts here: https://cmdspace.io/keyboard-shortcuts/chrome-dev-tools …#keyboardshortcut#mac#productivity#ChromeDevToolspic.twitter.com/BEBBnmsvJY Thanks. Twitter will use this to make your timeline better. UndoUndo
 -
Audits panel is the best place to start the journey. https://developers.google.com/web/tools/lighthouse/#devtools …https://twitter.com/charliesbot/status/1169287316084547589 …
Thanks. Twitter will use this to make your timeline better. UndoUndo


Loading seems to be taking a while.
Twitter may be over capacity or experiencing a momentary hiccup. Try again or visit Twitter Status for more information.
